
Overview
In the user guide series for gaining epidemiological insights we walk you through examples of genomic epidemiology (epi) investigations. The series includes four parts that highlight topics relevant to applying genomic epi to public health. Before going into the different topics, you might want to review basic concepts for understanding genomic epi data generation and interpretation. Here we briefly describe how sequence alignments are used to generate phylogenetic trees and why the molecular clock is at the core of genomic epi investigations. We provide links to resources that explain each of these topics in more detail, including sections from the Applied Genomic Epidemiology Handbook, throughout the guide.
After reading this guide, you will:
- Become familiar with sequence alignments
- Understand how the molecular clock is relevant to genomic epi
Phylogenetic trees come from sequence alignments
Phylogenetic analyses allow us to investigate genetic changes (mutations) that a given pathogen is accumulating over the course of an outbreak and, thus, infer its evolutionary history. To gather information for phylogenetic tree building, we need to compare consensus genome sequences relative to a reference ancestral sequence and identify which sites of the genome are changing at the population level and how sequences relate to each other over time. These comparisons are done through multiple sequence alignments (MSAs), which allow us to evaluate evolutionary relationships and common patterns between sequences. By performing MSAs, we can compare three or more sequences based on equivalent sites across the pathogen genome and identify sequence similarities that theoretically result from a common evolutionary history. We can also identify unique mutations observed in a single sequence or subset of sequences.
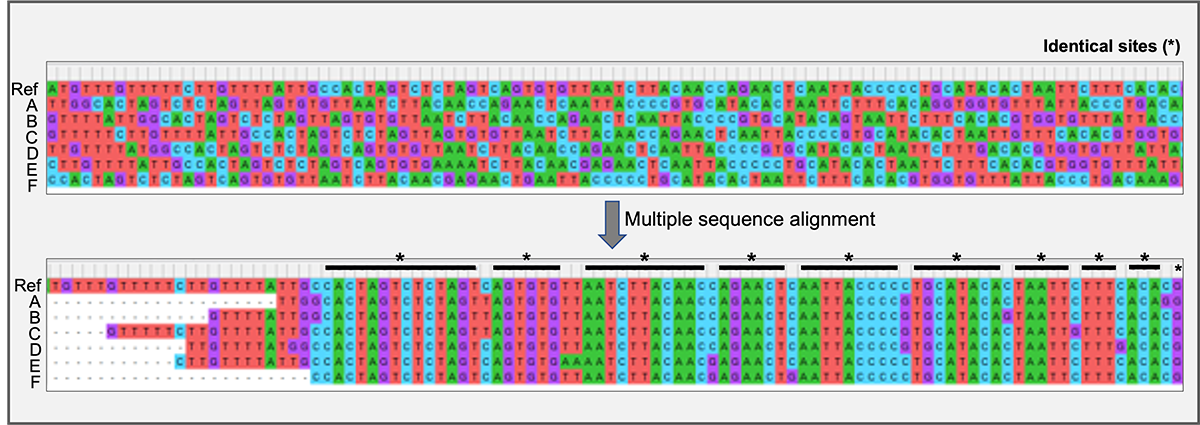
Example of seven sequences (reference and sequences A through F) before and after multiple sequence alignment (MSA). Nucleotides are highlighted with different colors for visualization purposes (A = green; T = red; G = purple; C = blue). Note that before the MSA (top panel) sequences do not seem to share any similarities or identical sites. This is because sequences have different lengths and they need to be aligned to ensure that we are comparing equivalent sites. After the MSA, we can see that sequences share many identical sites, with only 10 sites that differ between comparable sites (sites with data).
After sequences are aligned, we can calculate the difference or divergence between sequences based on shared and unique mutations. Genomic differences calculated through MSA tools are then summarized and displayed using a phylogenetic tree. Phylogenetic trees infer evolutionary history using a branching structure, where branches represent shared genetic history (shared mutations) and branch lengths indicate the amount of genetic change between sequences found in different branches (the longer the branch, the more mutations have occurred). Practice reading phylogenetic trees here. Below is a schematic from the Applied Genomic Epidemiology Handbook summarizing the relationship between an MSA and a phylogenetic tree. You can also see the short video From sequences to trees for more information.
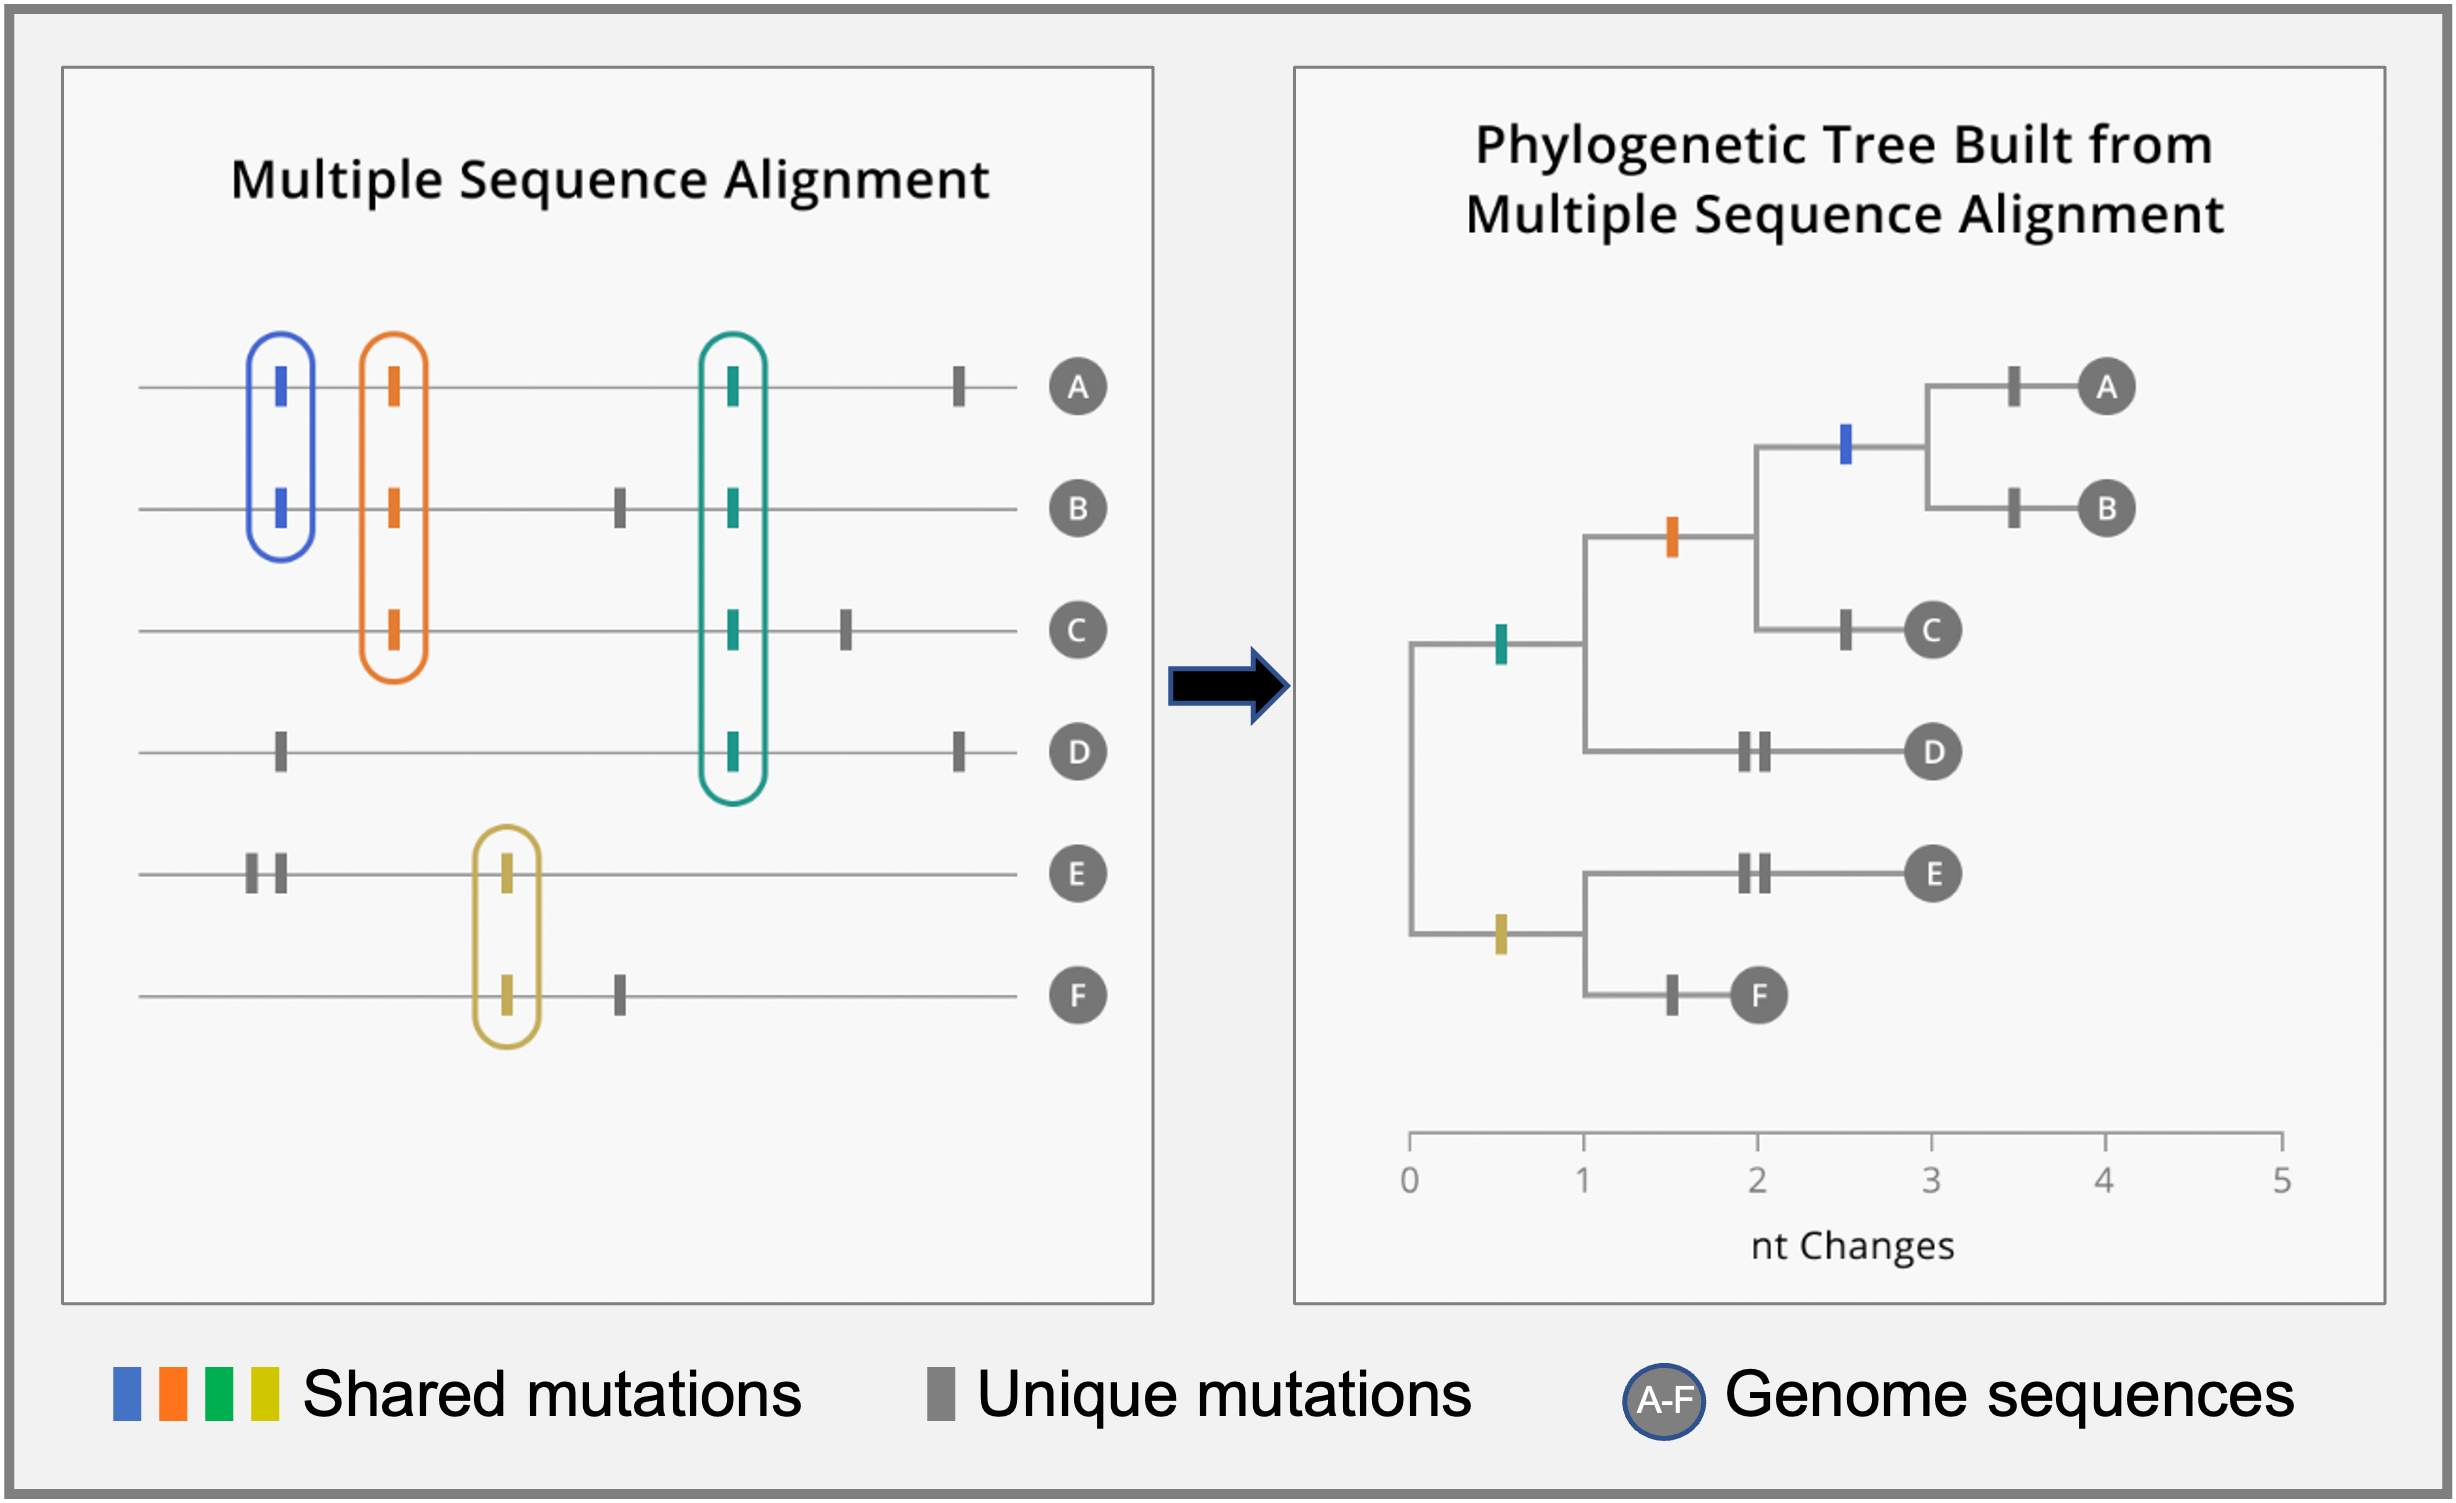
Schematic multiple sequence alignment (MSA) for six genome sequences (left) and the resulting phylogenetic tree (right). Shared and unique mutations between genomes are highlighted with colored and gray tick marks, respectively. Mutation patterns identified through the MSA (shared vs unique mutations) are used to build a phylogenetic tree summarizing evolutionary relationships. Mutations are organized along branches. Sequences that share mutations descend from the same internal branch. For example, sequences A – D share the green mutation seen in the MSA panel and, thus, they are all organized under the same internal branch where the green mutation occurred. On the other hand, unique mutations are displayed on external branches where the only descendant is the sequenced sample (branch tip). For a detailed description see What is a phylogenetic tree? within the Applied Genomic Epidemiology Handbook.
Relevance of MSAs for genomic epi data interpretation: It is important to do quality control checks on consensus genome sequences to minimize MSA errors. If sequences have poor quality, the MSA may result in erroneously aligned genomic regions which, in turn, will result in a misleading phylogenetic tree. If you see unusually long branches and/or sequences that seem out of place on your tree, it is always a good idea to check the MSA for errors.
Molecular clock and evolutionary rate
We can use differences between genomic sequences sampled over the course of an outbreak to better understand pathogen transmission dynamics, including the timeline of pathogen transmission events. This is possible because we can translate between mutations observed in consensus genomes and calendar time using the molecular clock principle, which tells us about the timing of evolutionary events. The molecular clock, as implemented in genomic epi, is based on the idea that differences in the number of mutations between consensus genomes from a given pathogen can tell us something about the time that has passed for those mutations to accumulate because these mutations presumably happen at a constant rate. This means that the number of differences between two genome sequences that are sampled at different times will increase as time passes between the two sampling events. The number of differences between the two genomes can then be used as a measure of time.
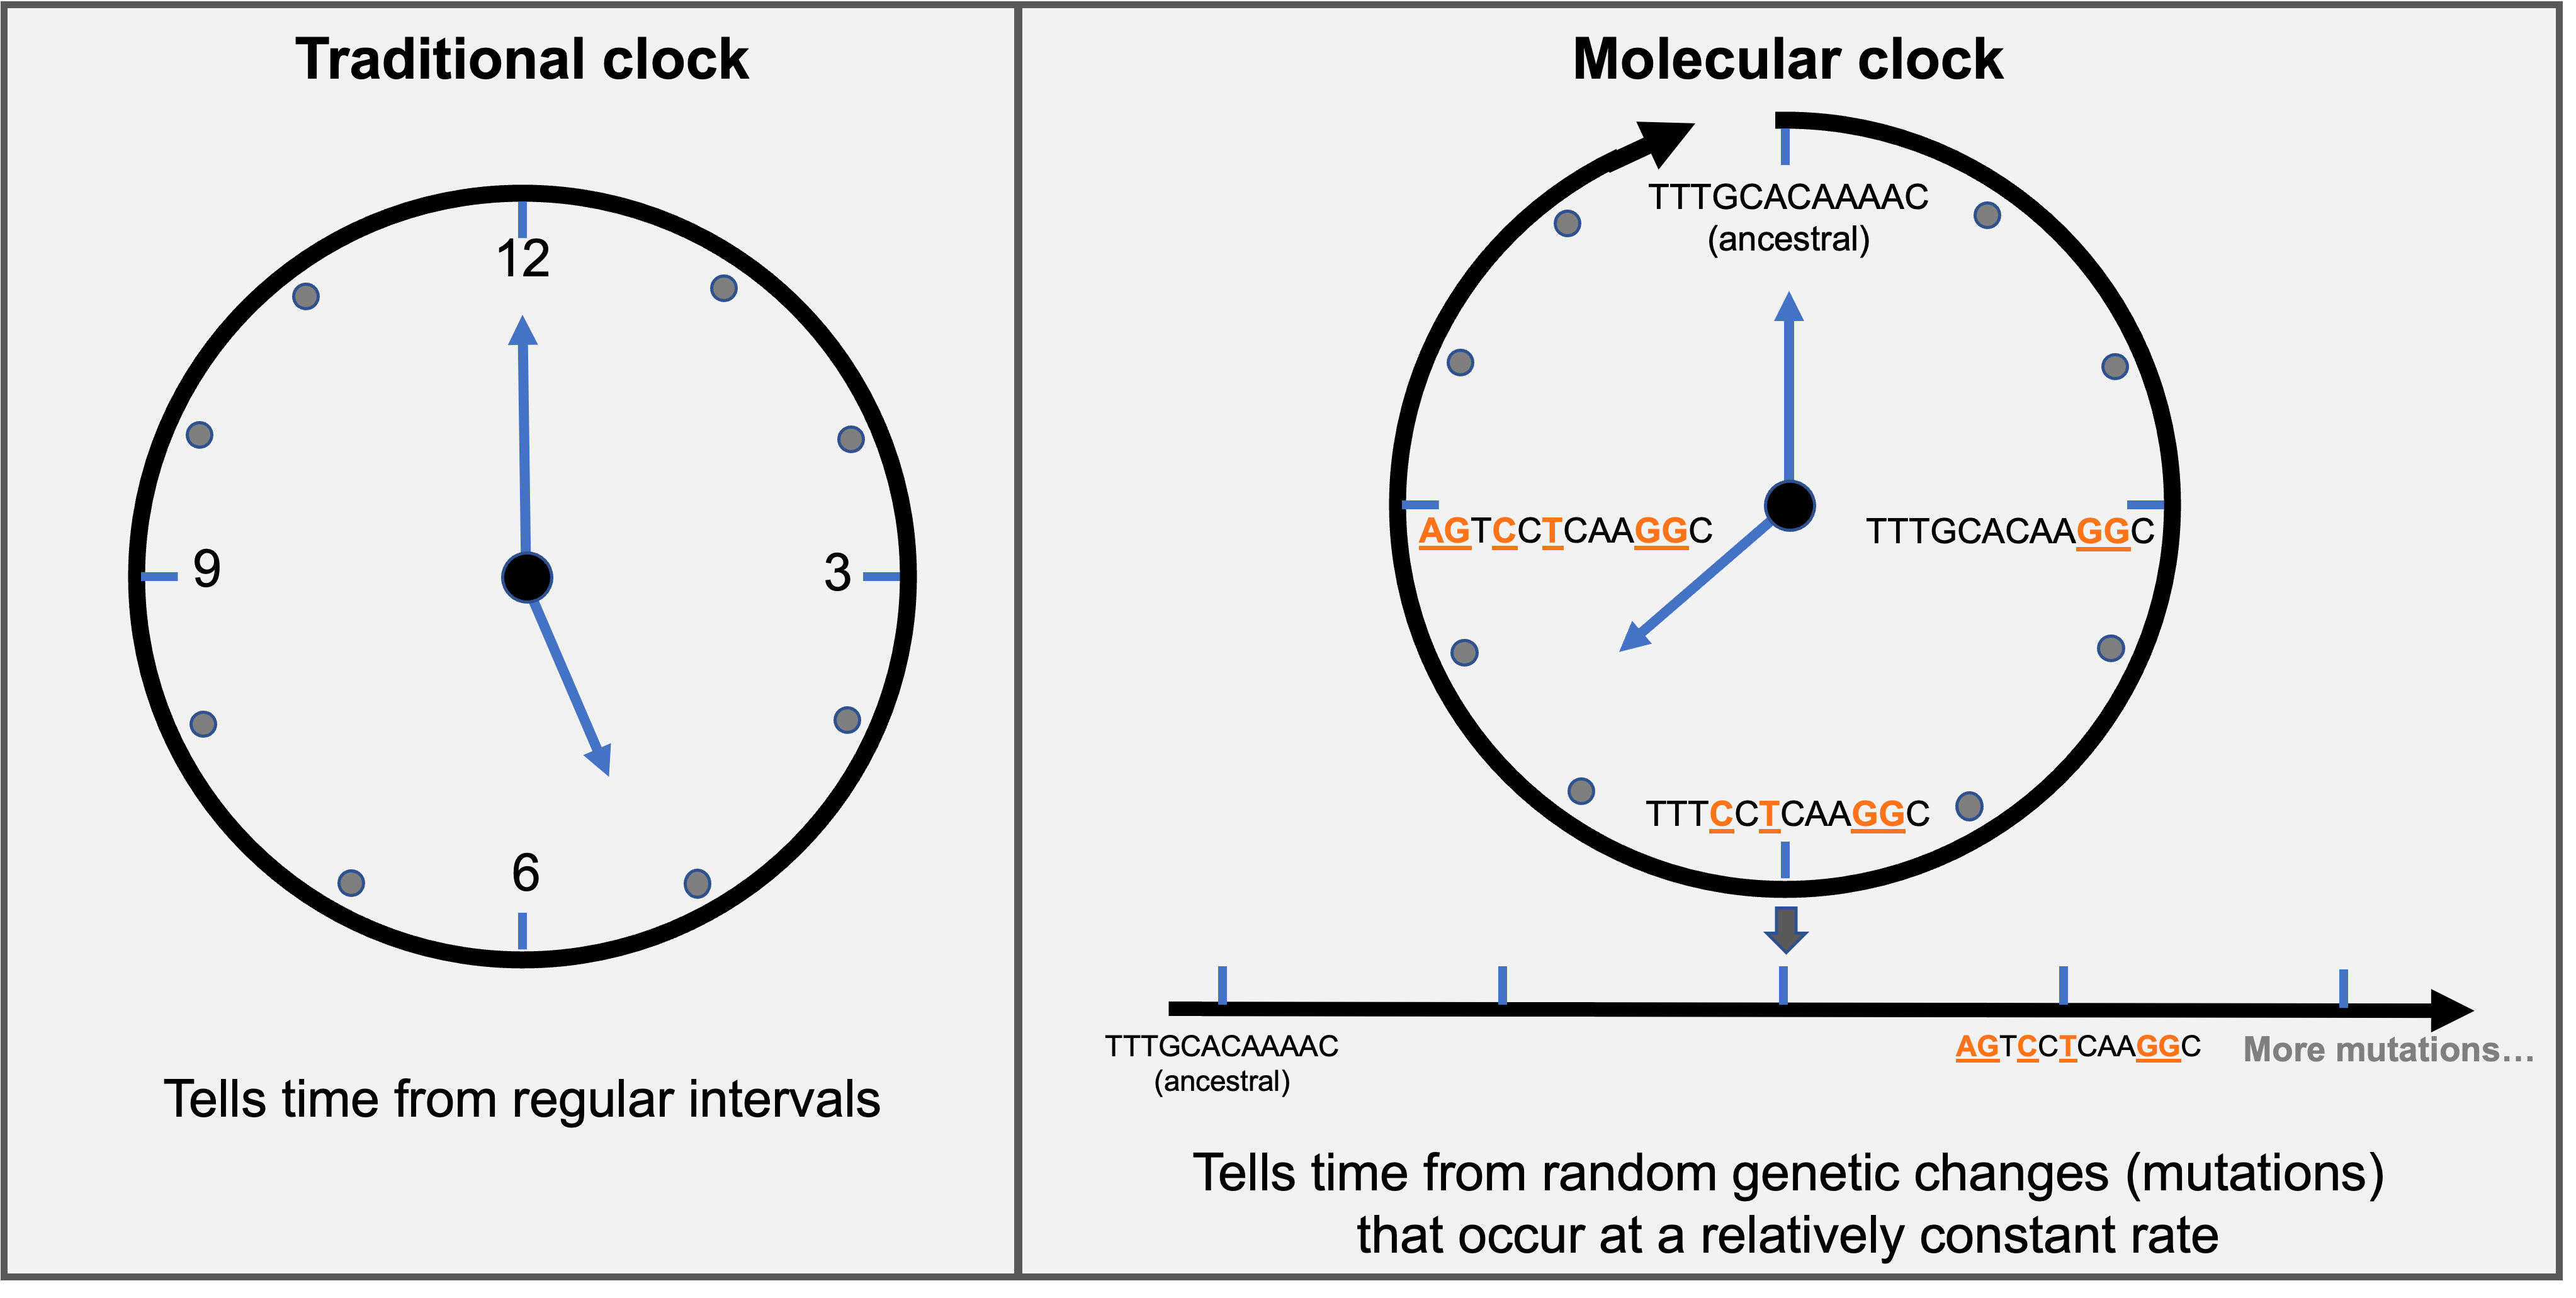
Schematic representation of a molecular clock analogy. The molecular clock is not a traditional clock that tells time by regular intervals (ticks on the clock). Instead, the molecular clock tells time from random mutations that happen at a relatively constant rate. Mutations relative to an ancestral sequence are highlighted in orange. Mutations will continue to accumulate over time (continuous process). The schematic was inspired and adapted from an interview published here.
In the example provided above, there are two mutations accumulated, relative to the ancestral sequence, as time passes (nucleotides highlighted in orange). If we want to know how much time has passed based on sequence comparisons, we need to figure out the speed of the molecular clock (is it 2 mutations per week, month, or years?). Let’s say that we know that there are two mutations accumulated per month for the example above. If that’s the case then we know that the sequence at the 9 o’clock position emerged about 3 months after the ancestral sequence. The speed at which mutations are observed over time is known as the evolutionary rate (how fast is the molecular clock ticking). On average, for SARS-CoV-2 genomes we observe approximately two mutations per month. Evolutionary rates are important because they give us an estimate of how many mutations we should expect to see over a given time period. See Tree quality checks for a discussion on how evolutionary rates can help you evaluate your tree.
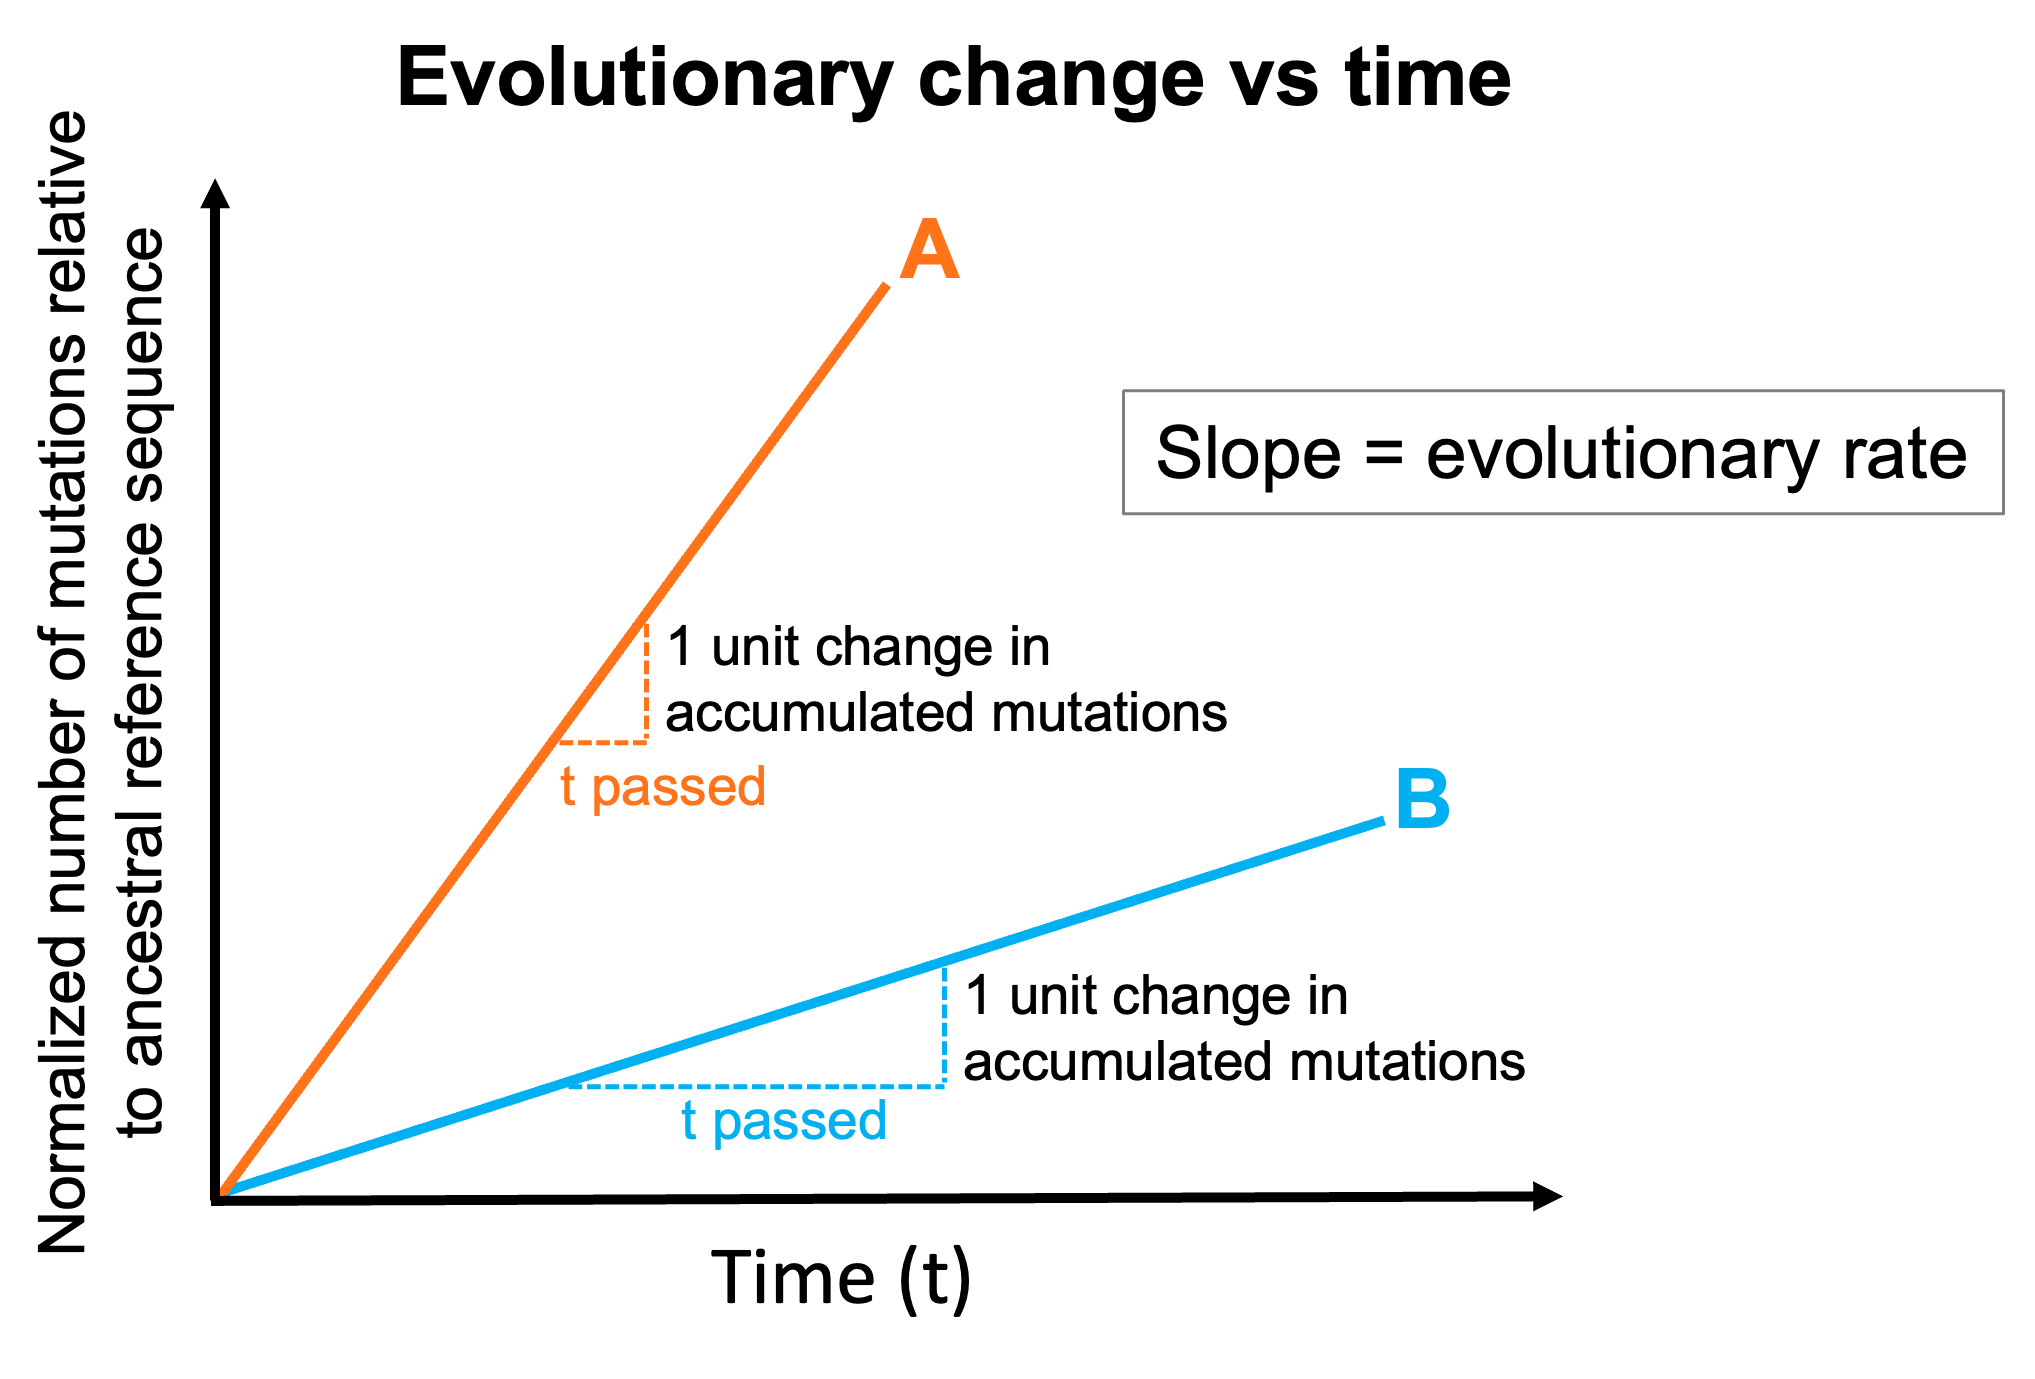
Hypothetical plot showing accumulated mutations in consensus genomes from two pathogens (A and B) sampled over time. Plotting this relationship allows us to calculate the evolutionary rate for pathogens, or how many mutations are expected to be accumulated and observed in sequenced genomes as time passes. Note that pathogen A (highlighted in orange) has a faster evolutionary rate than pathogen B (highlighted in blue) given that the time needed to observe one unit change in accumulated mutations is shorter for pathogen A compared to pathogen B.
In practice, the evolutionary rates are not absolute and rates calculated by different groups may differ. This is because estimated evolutionary rates will depend on various factors, including sampling scheme (how often and for how long samples are collected) and selection pressures acting on the pathogen at any given time. To see a detailed discussion about how evolutionary rates are calculated see Estimating evolutionary rates (molecular clocks) from sequence data.
Relevance of the molecular clock for genomic epi: The evolutionary signal provided by the molecular clock is important to estimate when a given pathogen diversifies into subsequent lineages using a familiar scale (calendar time). The molecular clock, which allows us to calculate evolutionary rates, is also important to evaluate epidemiological linkages between cases. To learn more about the molecular clock and evolutionary rates see Mutation rates, evolutionary rates, and the molecular clock.
Want to learn more?
See the following list of articles and videos to learn more about sequence alignments and molecular clocks.