
Overview
In the user guide series for gaining epidemiological insights we walk you through examples of genomic epidemiology (epi) investigations. The series includes four parts that highlight topics relevant to applying genomic epi to public health. Before going into the different topics, you might want to review basic concepts for phylogenetic tree interpretation. Here we review how to read phylogenetic trees. We provide links to resources that explain each of these topics in more detail at the end of the guide.
After reading this guide, you will:
- Become familiar with terms used to describe phylogenetic trees
- Practice reading divergence trees
- Practice reading time trees
- Practice reading trees for genomic (gen) epidemiology (epi)
Phylogenetic trees
Phylogenetic trees are diagrams that summarize evolutionary relationships between organisms using a branching structure. These diagrams are not absolute, meaning that they display evolutionary history hypotheses. The evolutionary history displayed on trees is based on genetic changes (mutations) that theoretically happened in the past and are inherited by descendants, who gain additional mutations and pass them onto the next generation and so forth.

Phylogenetic tree depicting evolutionary relationships between 6 samples. The tree shows a hypothesis for how genetic information flowed from ancestral sequences to the sequences we observe today.
Phylogenetic tree “lingo”
The phylogenetic tree structure is used to represent shared genetic history (shared mutations) along branches. Branch lengths indicate the amount of genetic change between sequences found in different branches (the longer the branch, the more mutations have occurred). Below we define each part of the tree, including branch tips, nodes, branches, and clades. Note that there are different types of tree layouts (e.g., circular and radial), but we only use rooted rectangular trees as examples here.
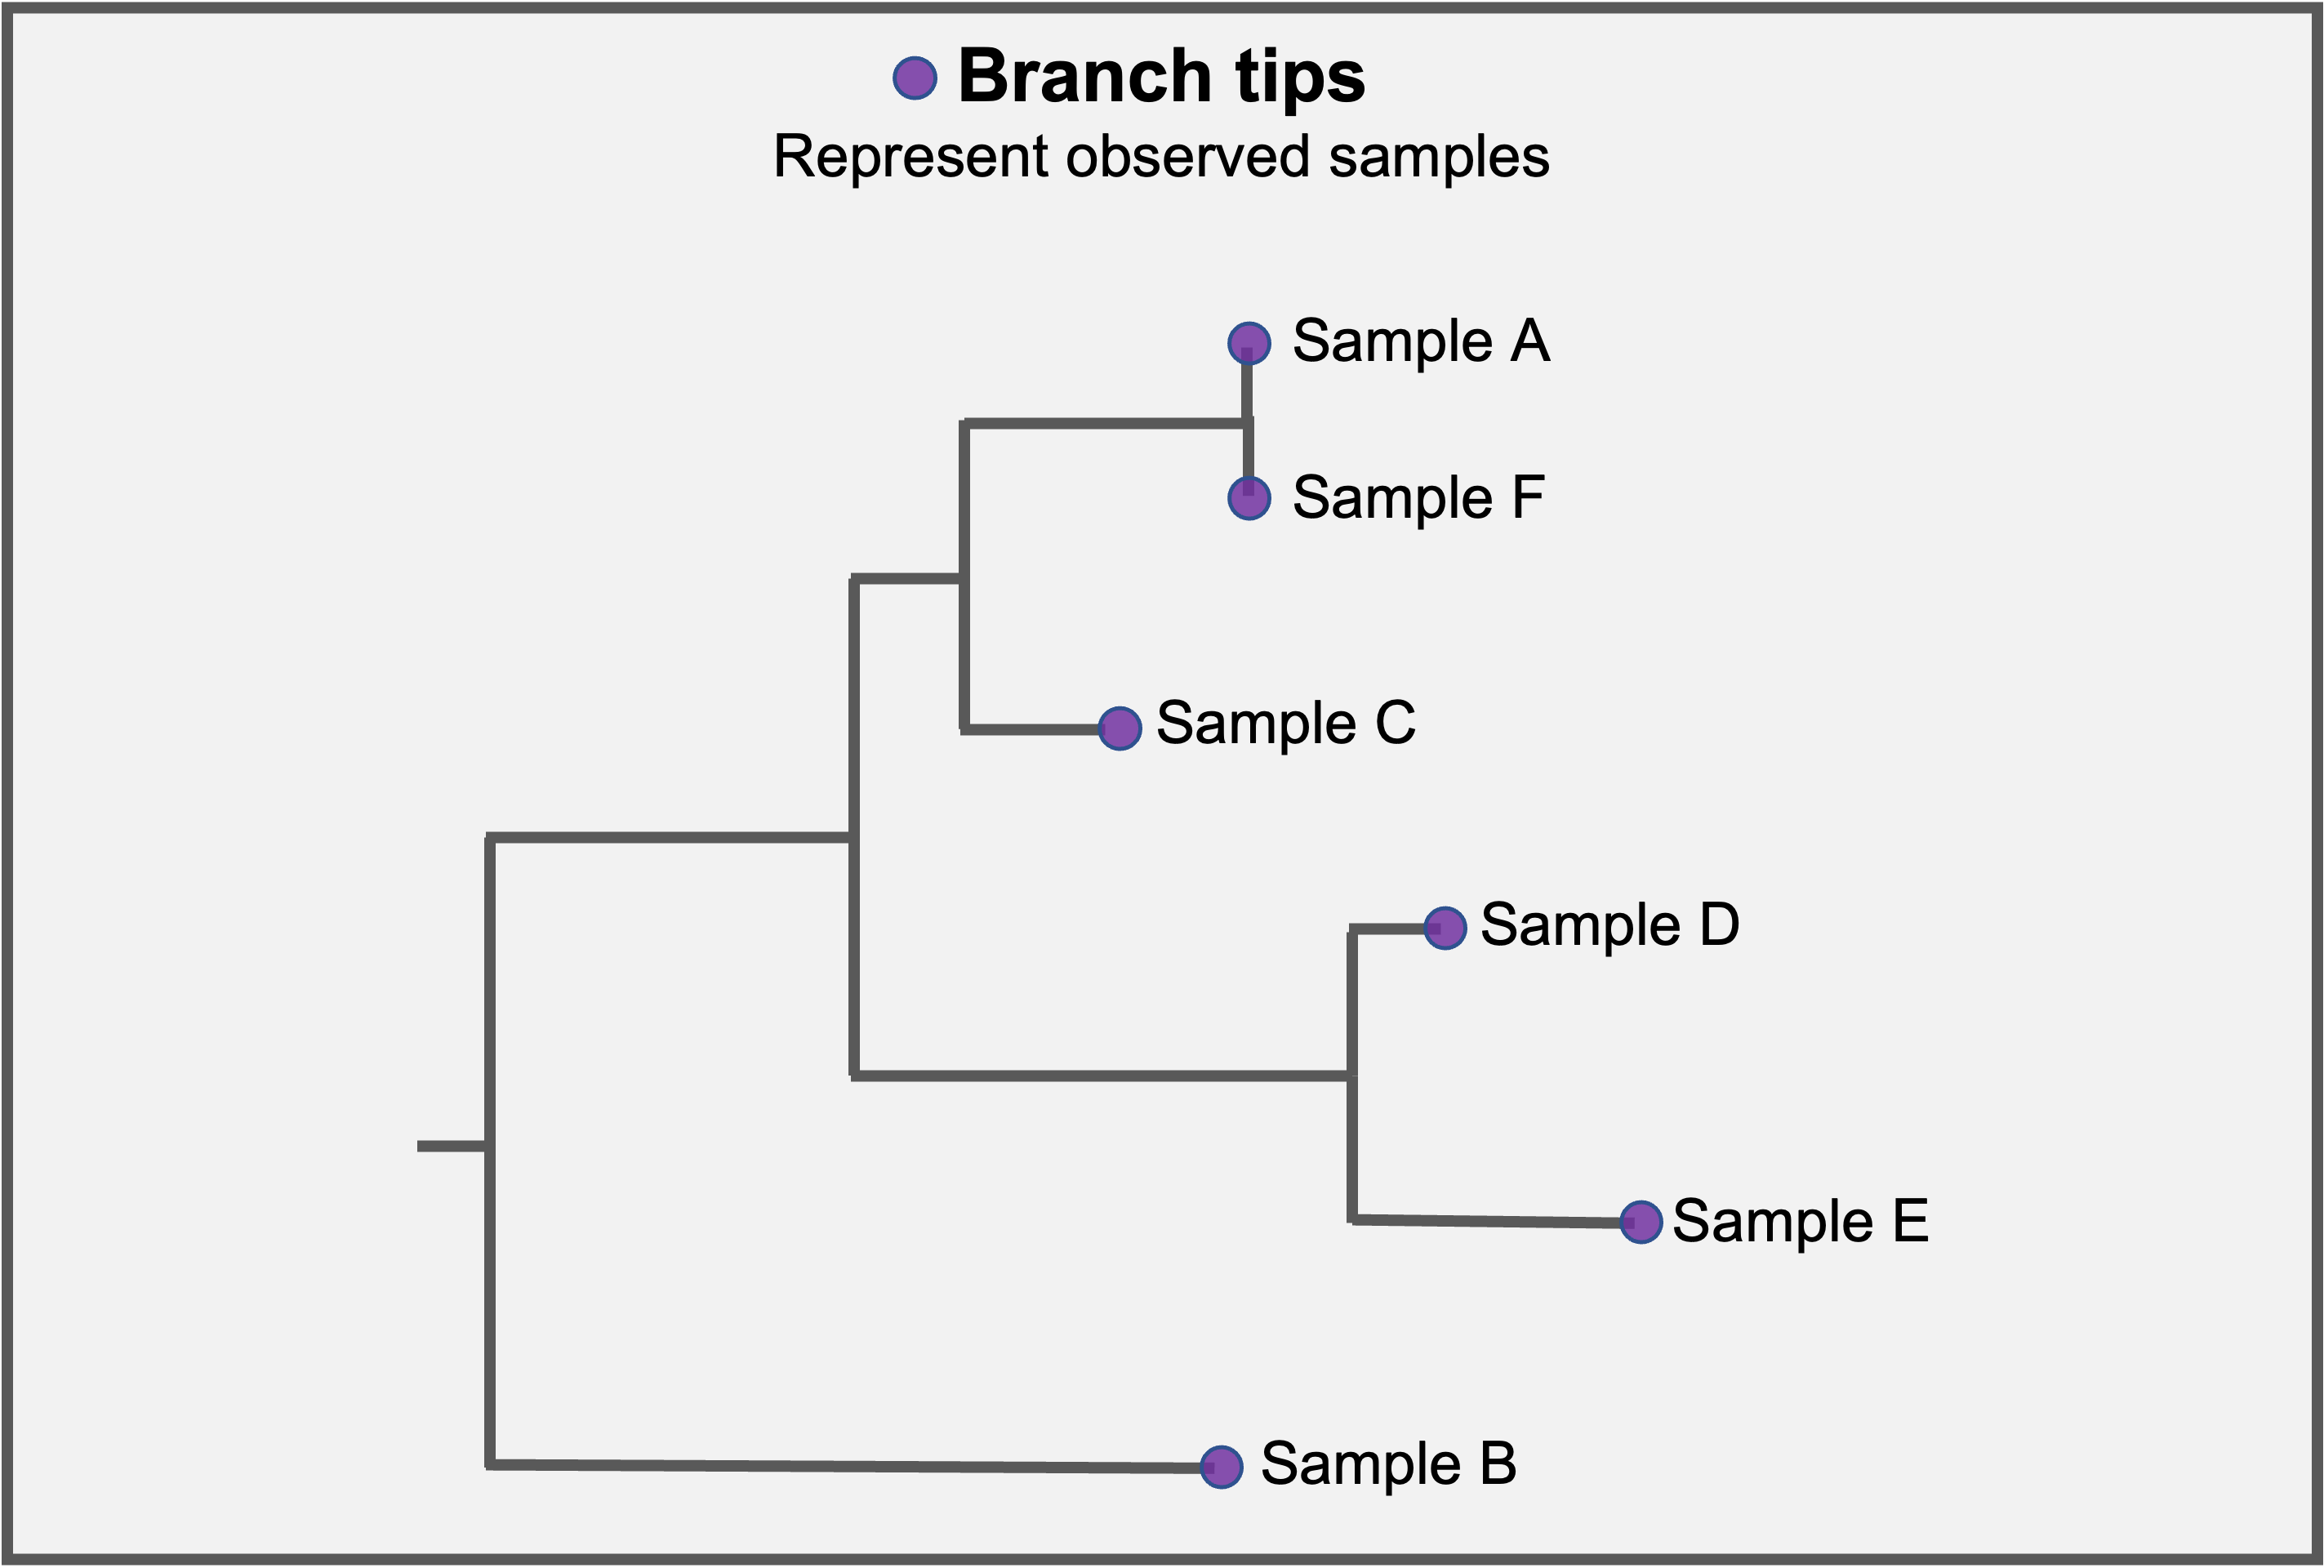
Samples that have been sequenced appear in the branch tips of the tree. Branch tips may or may not be labeled.
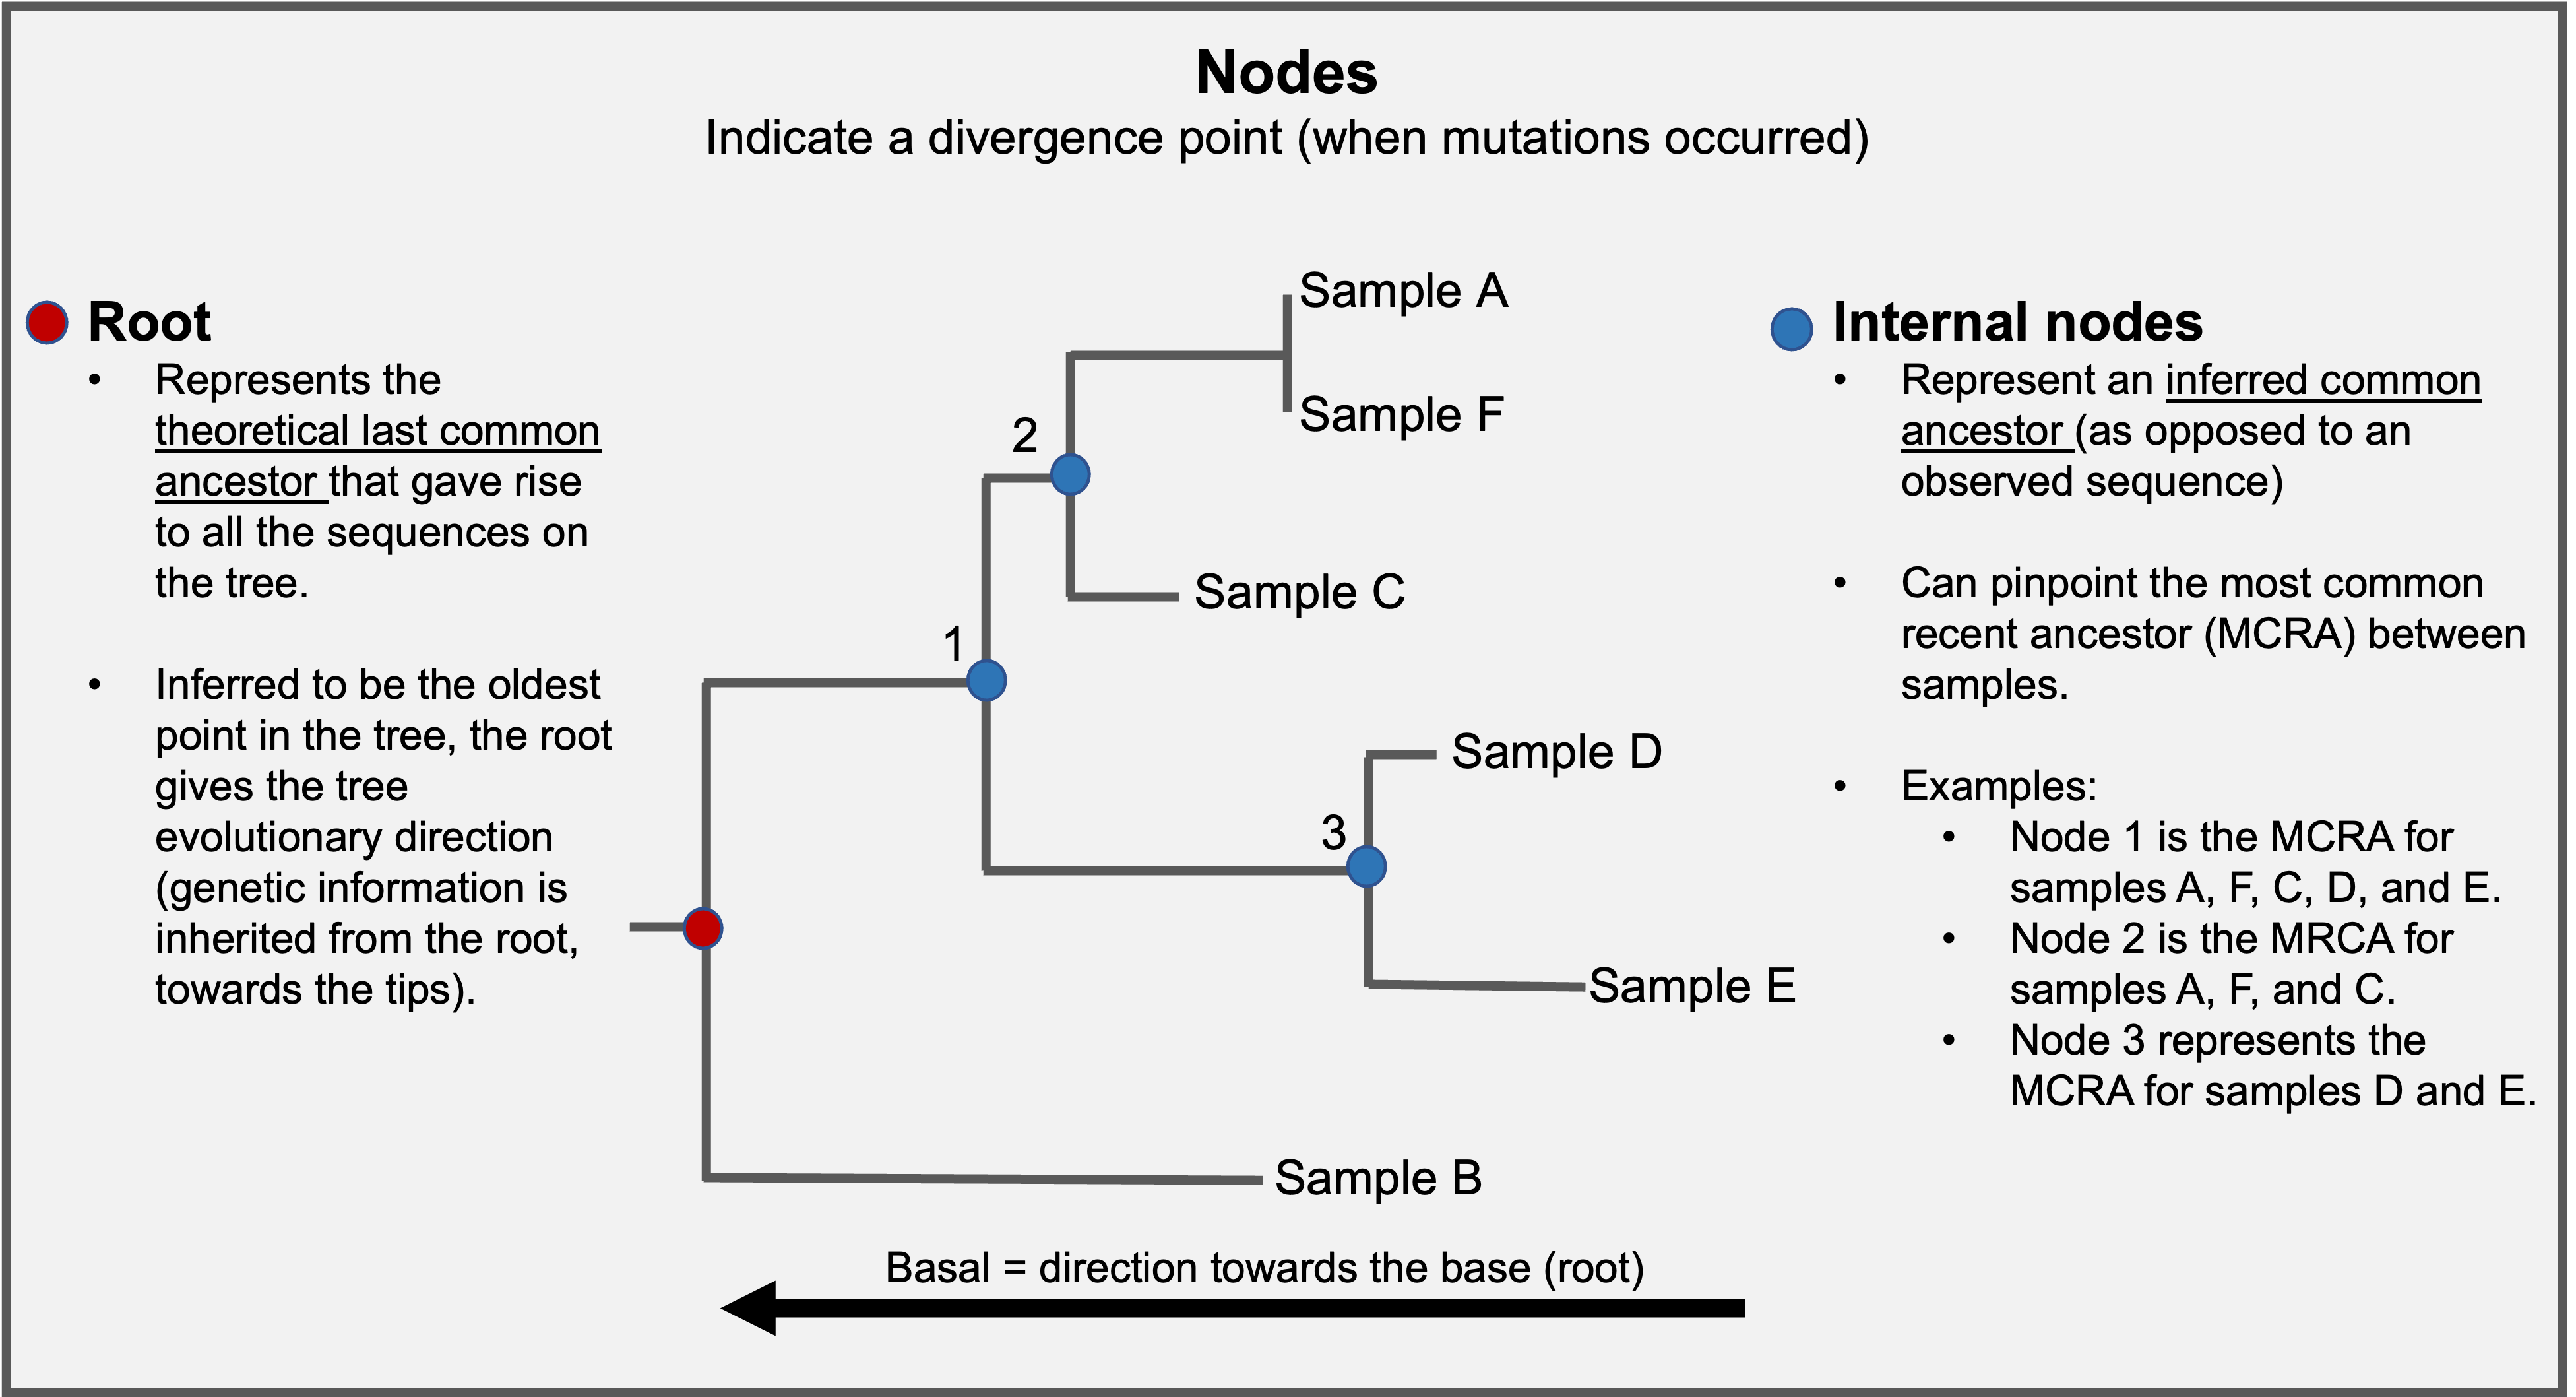
Nodes are branching points within the tree and indicate where samples along a given branch diverge. Each node represents the last common ancestor of samples descended from that node. Nodes that are basal are closer to the root and are ancestral to nodes closer to branch tips. For example, node 1 is basal or ancestral relative to node 3.
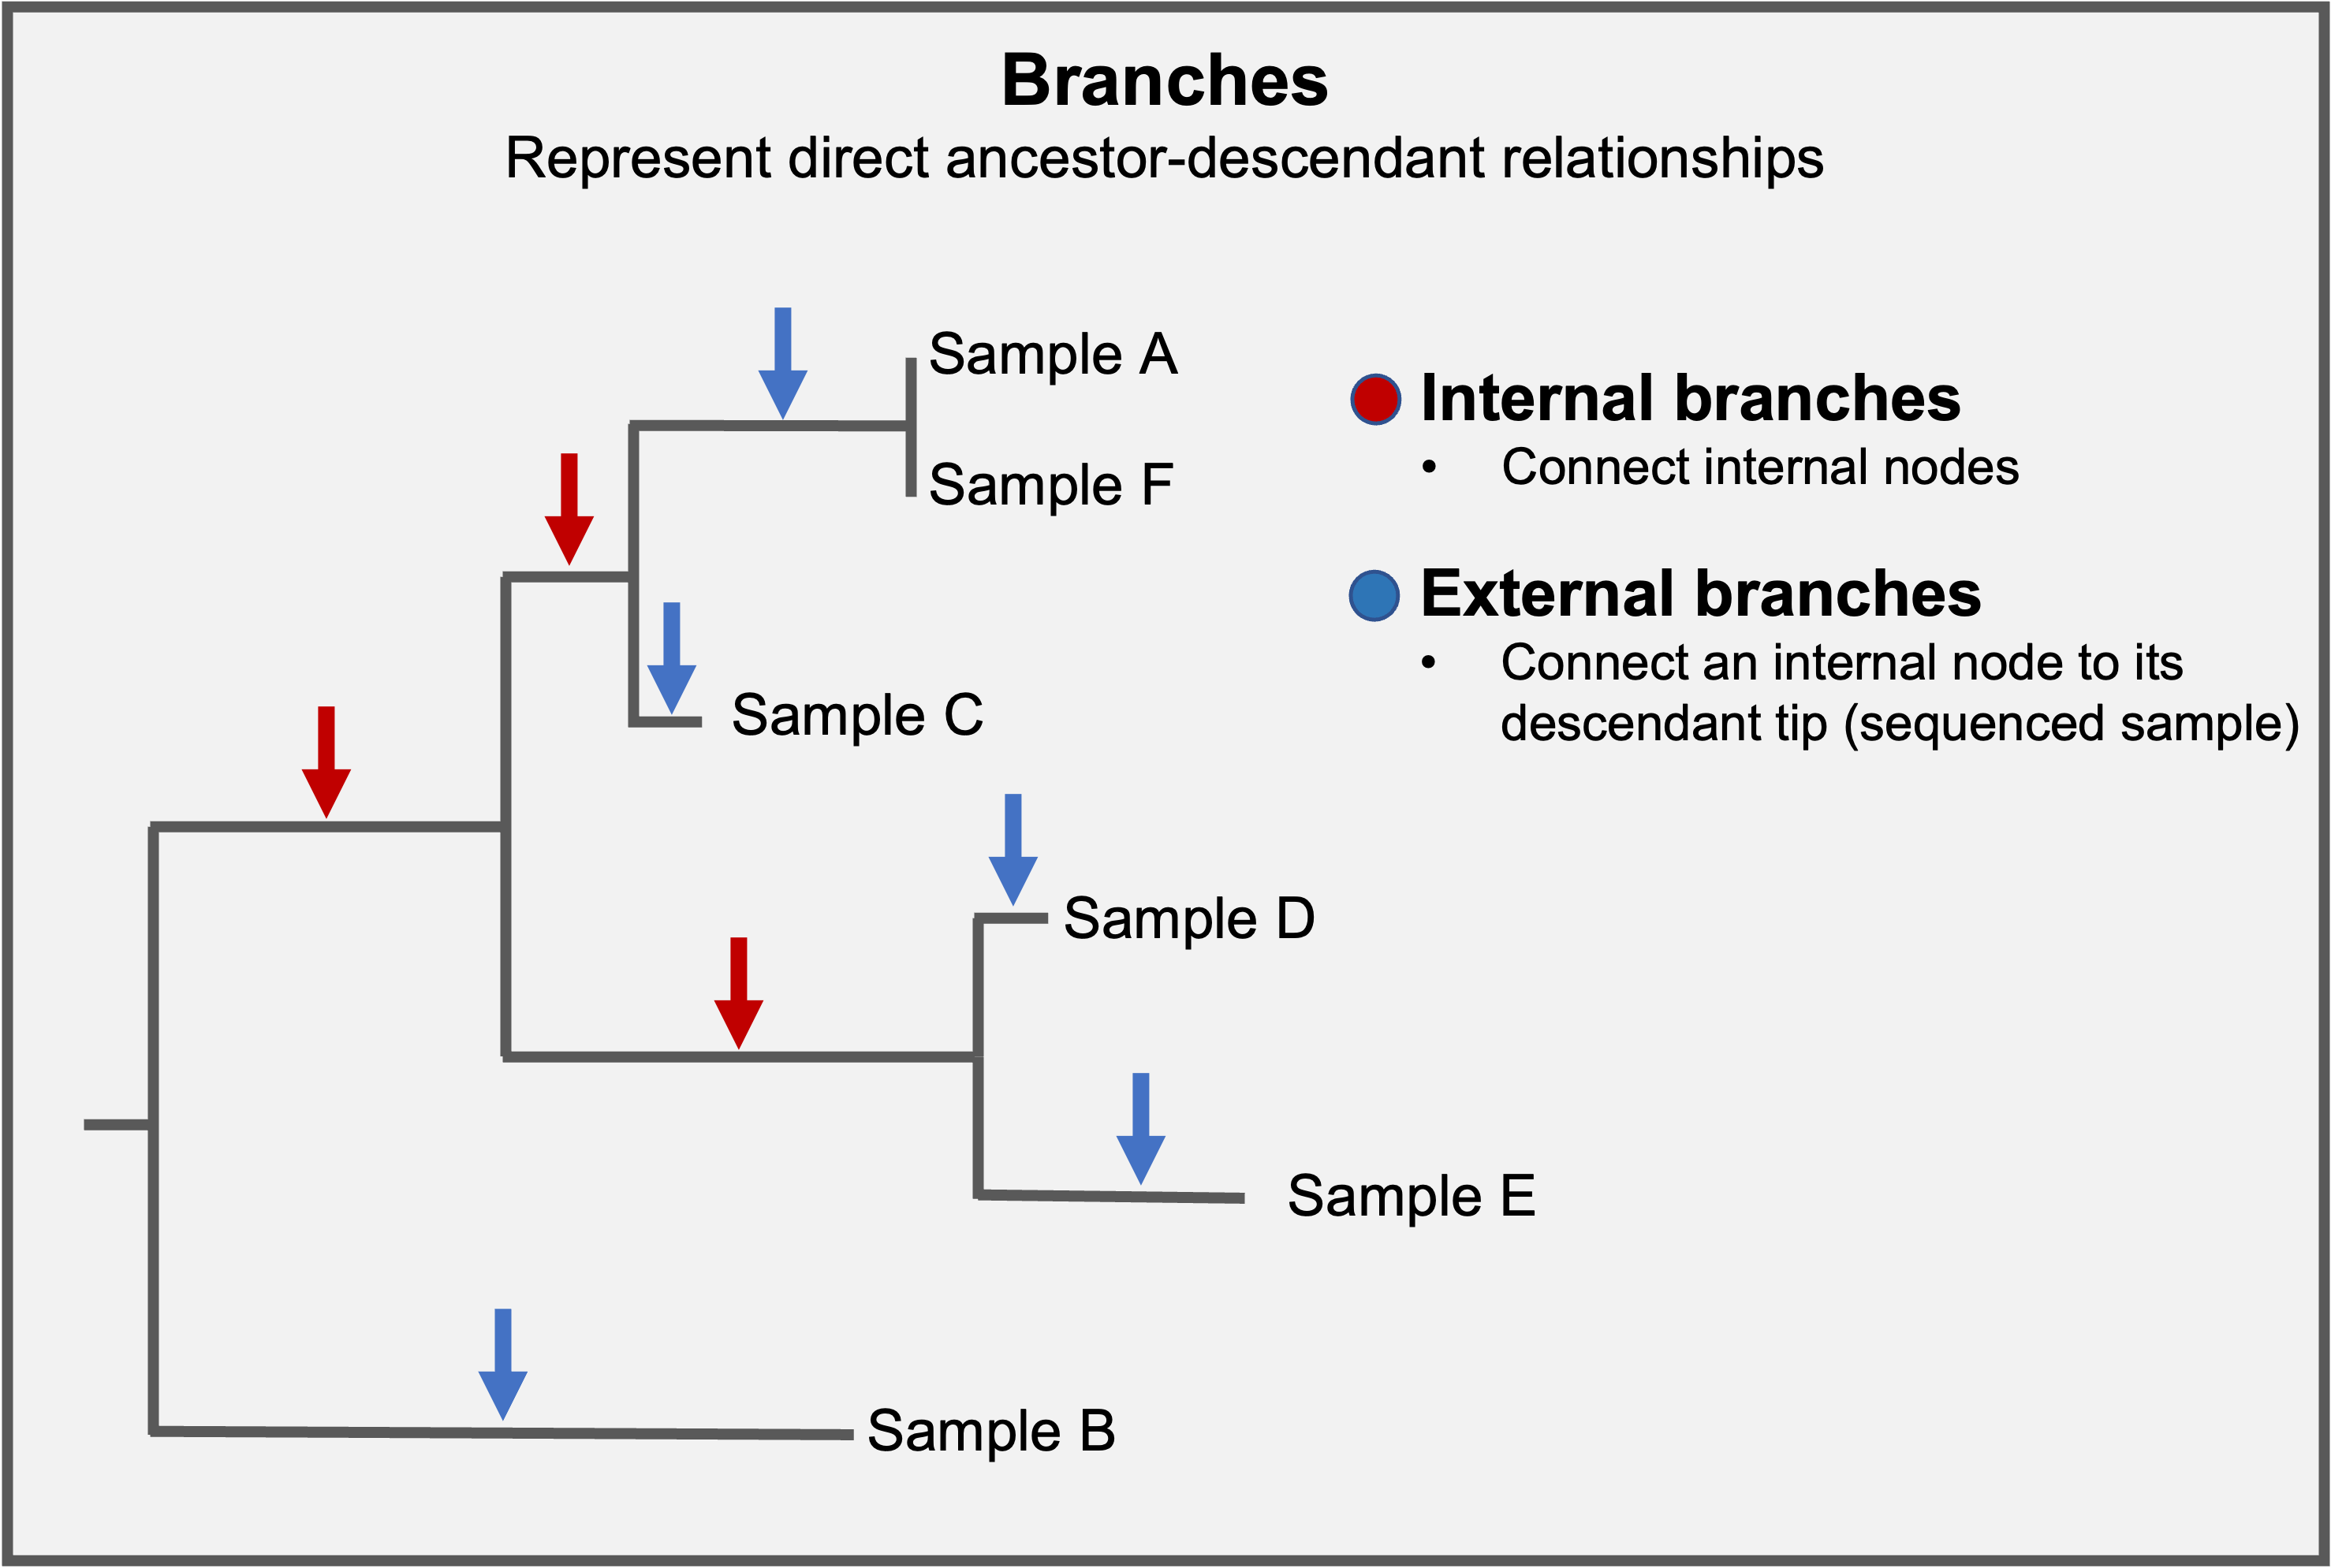
Branches connect nodes within the tree (internal branches) or nodes with branch tips (external branches).
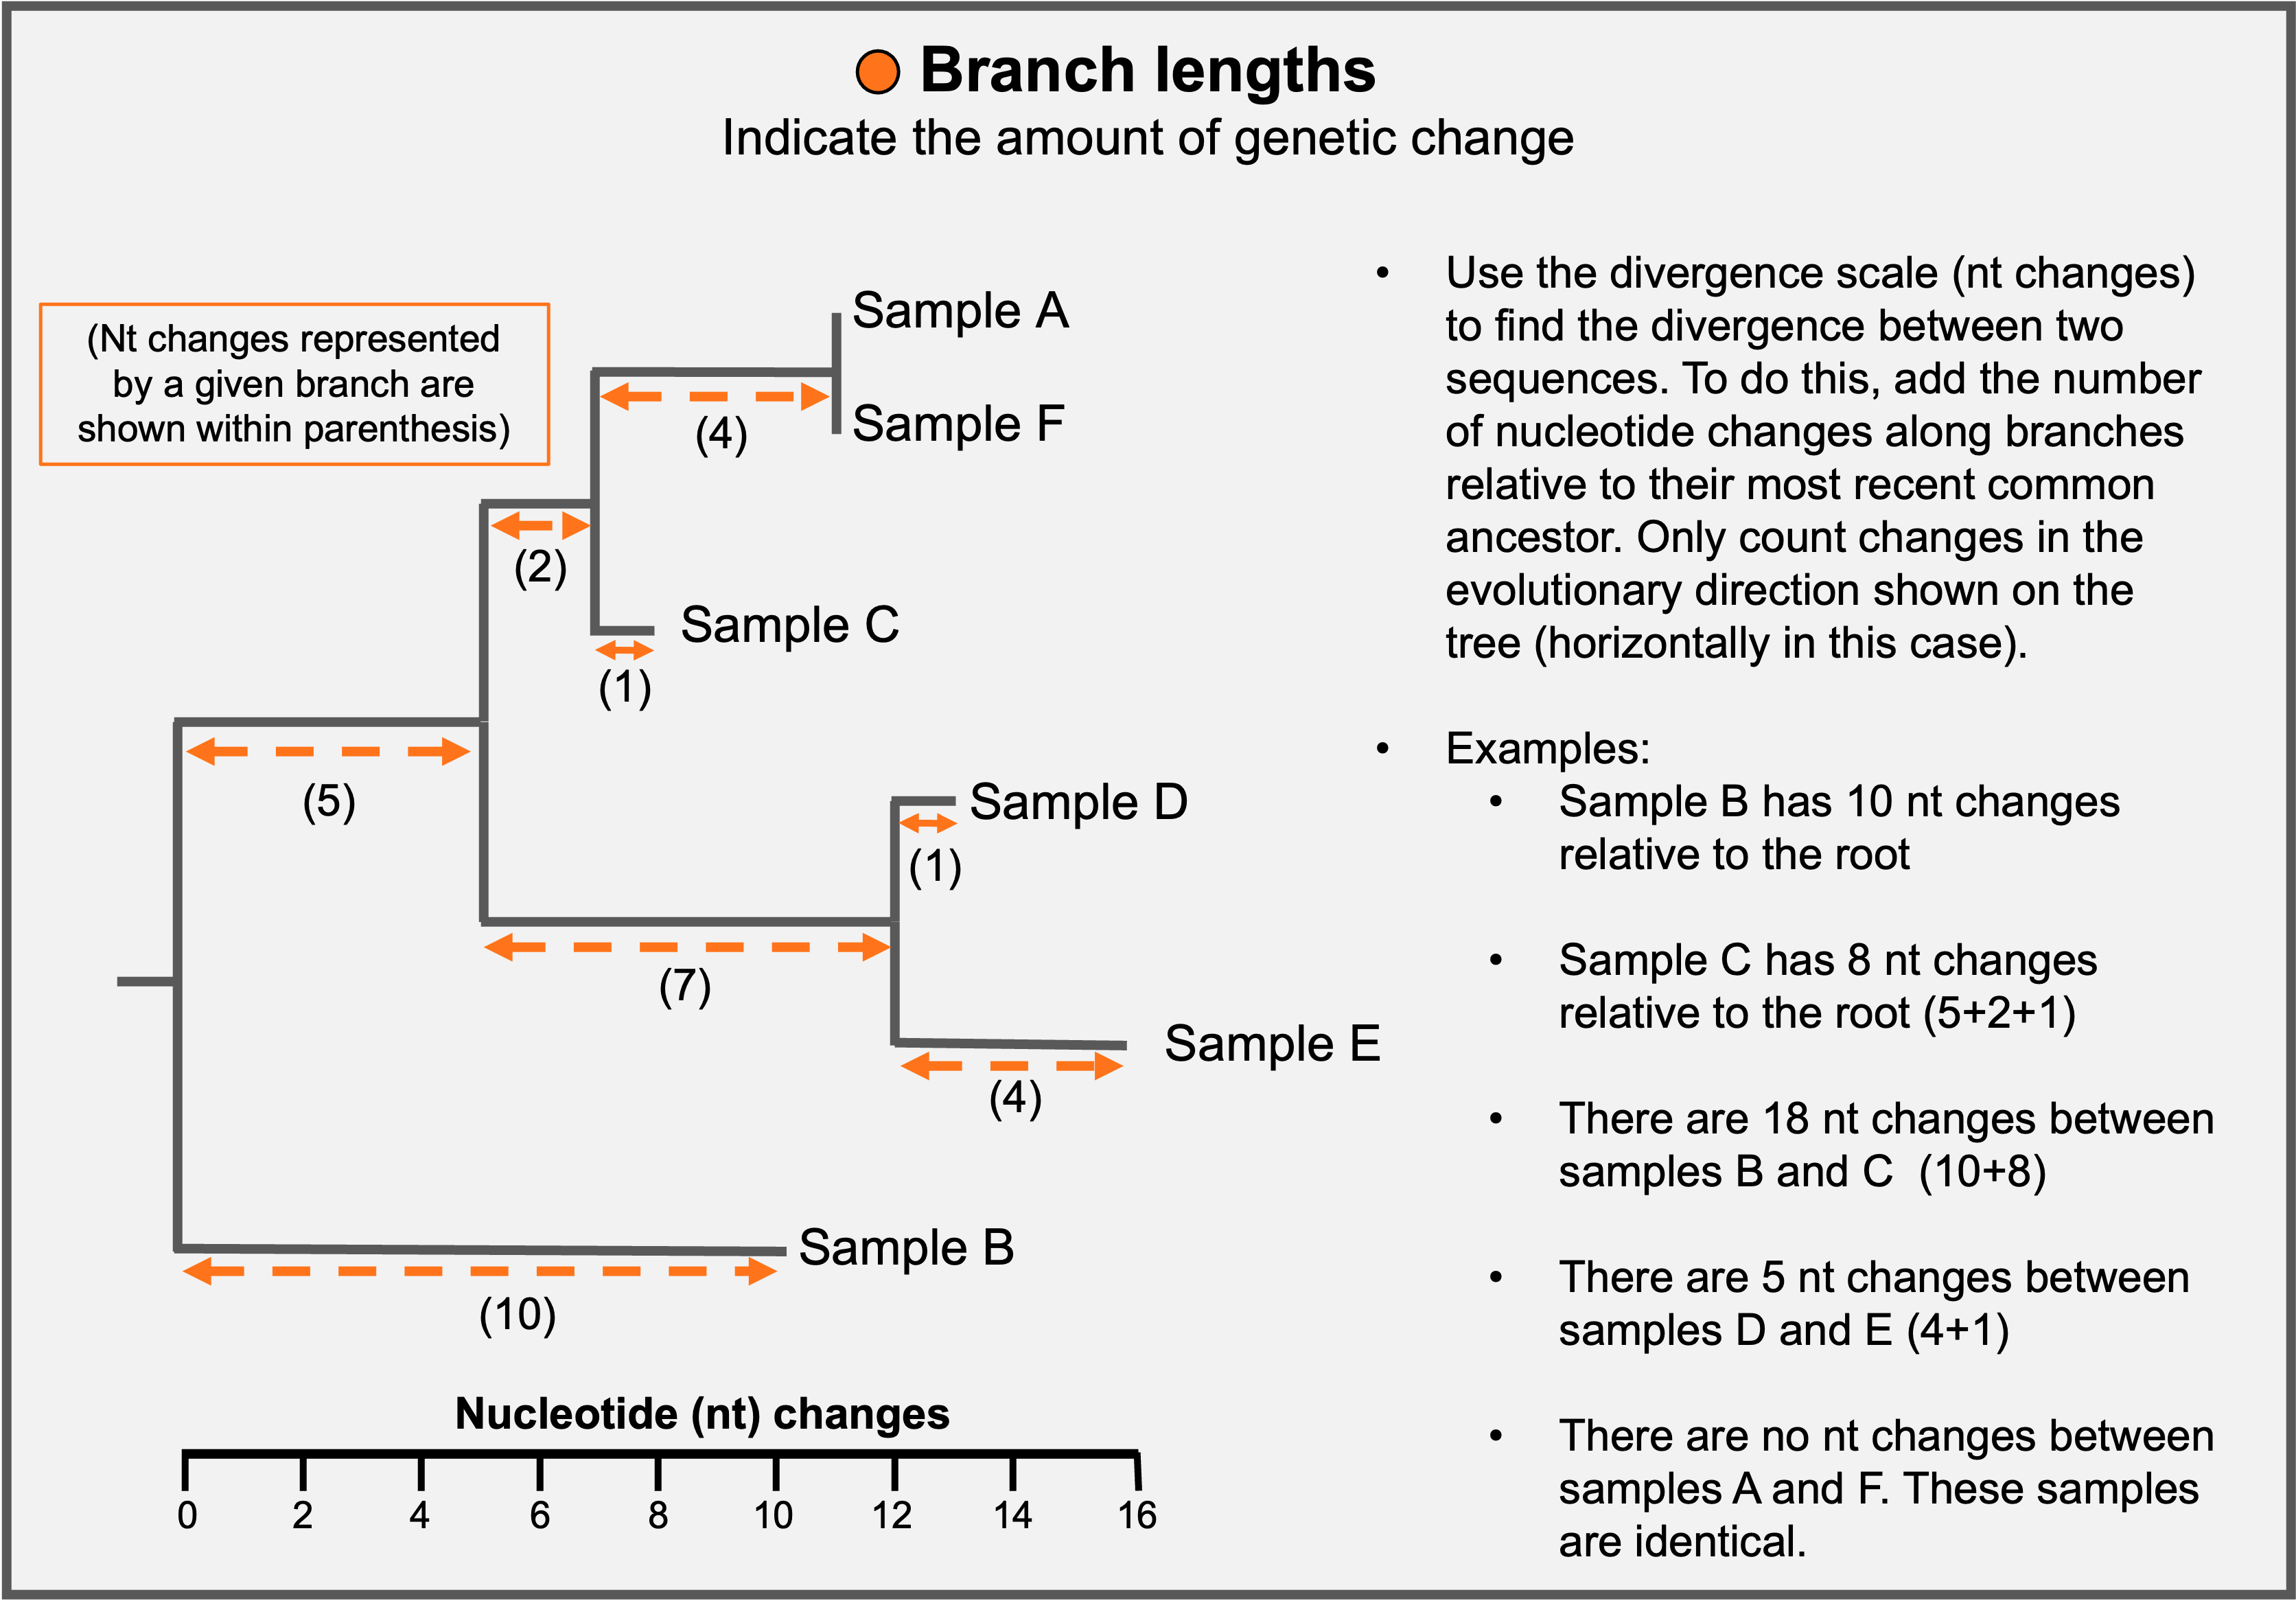
If the tree is scaled by nucleotide changes (mutations), branch lengths provide a measure of genetic distance between samples.
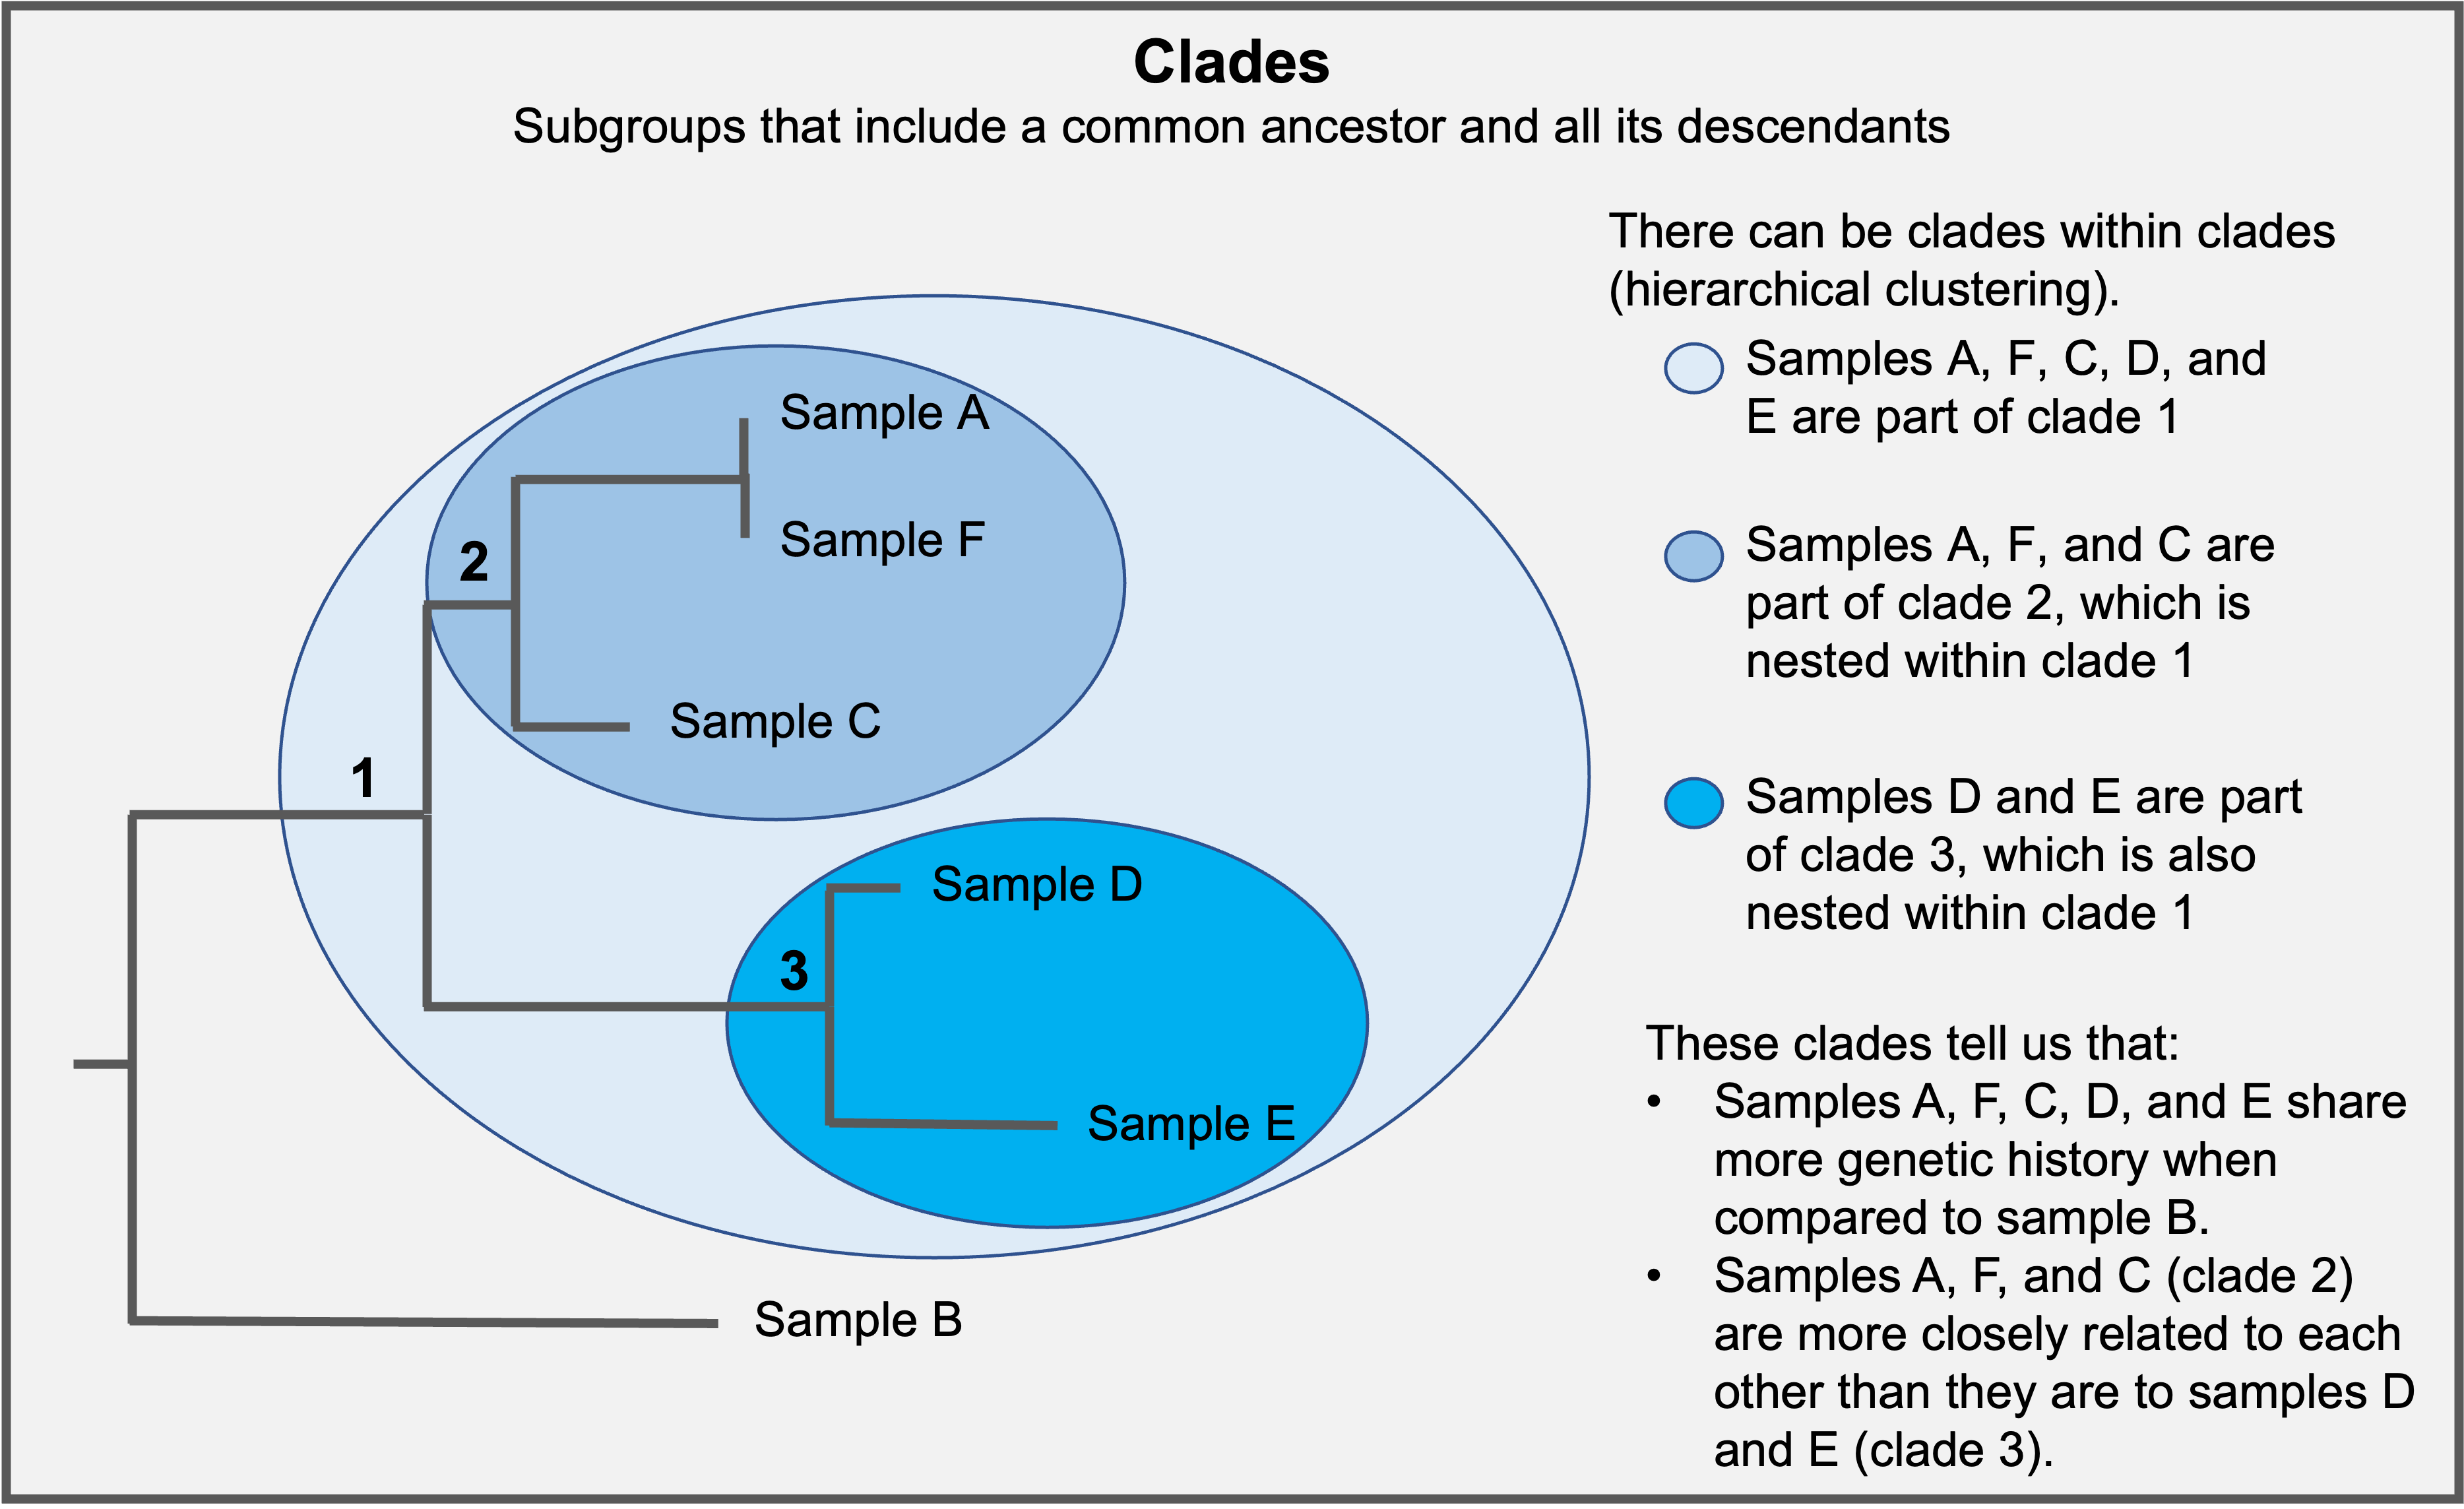
Samples that share mutations can be highlighted through clades. Samples within a given clade presumably inherited mutations from a common ancestor. Therefore, samples found within the same clade are more closely related to each other than samples in other clades. Samples within a clade may be referred to as a monophyletic group.
Practice reading trees: General example
Now that you reviewed some phylogenetic tree basics, let’s practice reading Nextstrain SARS-CoV-2 trees. Look at the divergence tree below to answer questions.
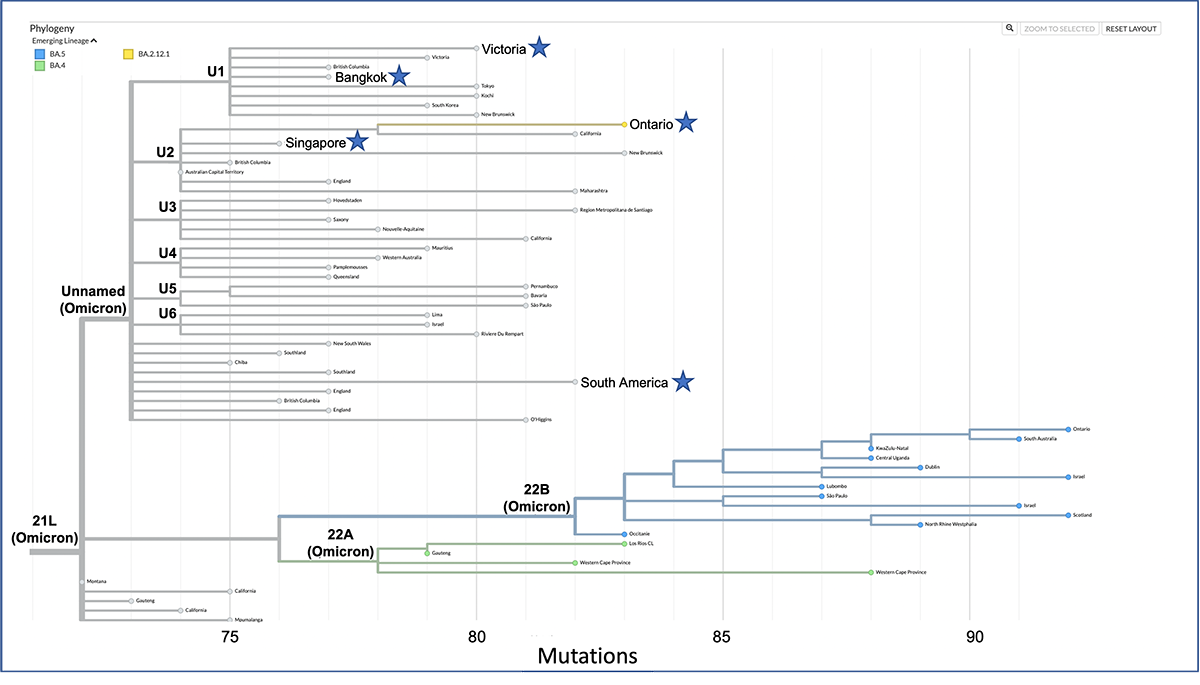
General example depicting a divergence Nextstrain tree. Clade names are highlighted in bold font. Samples needed to answer the questions below are highlighted with a star.
Focus on samples highlighted with a star on the tree shown above to answer the following:
- Which clade do all the highlighted samples belong to?
- Which two of the highlighted samples are the most closely related?
- Which two of the highlighted samples are the most diverged relative to the last common ancestor shown on the tree?
- How many nucleotide changes separate identified sequences in question #2?
- Which clade contains the most diverged samples relative to the last common ancestor shown on the tree?
- Which Unnamed sublineage (i.e., U1 through U5) emerged first?
Answers:
The divergence scale (mutations) is showing the number of accumulated mutations relative to a reference sequence. To answer the questions above you need to look for the difference in mutations relative to the most recent common ancestor (MRCA) between compared samples.
Same example tree highlighting the number of accumulated mutations (red) for each sample and common ancestors within the “Unnamed” clade.
- Which clade do all the highlighted samples belong to? All the samples belong to the Unnamed (Omicron) clade.
- Which two of the highlighted samples are the most closely related? Samples from Victoria and Bangkok are the most closely related because they are the least diverged pair from the highlighted samples. Their MRCA gave rise to the U1 clade, which has 75 mutations relative to the reference. When we add mutations relative to the MRCA for samples from Bangkok (77 – 75 = 2) and Victoria (80 – 75 = 5) we get (2 + 5 = 7). There are 7 nucleotide changes between samples from Victoria and Bangkok.
- Which two of the highlighted samples are the most diverged relative to the last common ancestor shown on the tree? The most diverged samples are samples from Ontario and South America. These samples are on different clades and have the longest branches within the Unnamed clade.
- What is the divergence between samples identified in question #2? The MRCA for samples from Ontario and South America gave rise to the Unnamed clade. Their MRCA has 73 mutations relative to the reference. When we add mutations relative to the MRCA for samples from South America (82 – 73 = 9) and Ontario (83 – 73 = 10) we get (9 + 10 = 19). The divergence between these sequences is 19 mutations.
- Which clade contains the most diverged samples relative to the last common ancestor shown on the tree? The 22B (Omicron) clade contains the samples with the most accumulated mutations on the tree (over 90 mutations for the most diverged samples within this clade). This clade is highlighted as an emerging lineage (BA.5).
- Which Unnamed sublineage (i.e., U1 through U5) emerged first? If you think you can’t answer this question with the available information, you are correct. The divergence tree does not tell us about timing. To answer questions about timing, we need to look at a time tree. Time trees display when samples were collected at the branch tips and estimate or infer when the common ancestors (nodes) for different clades emerged. Let’s take a look at the same tree scaled by time rather than divergence.
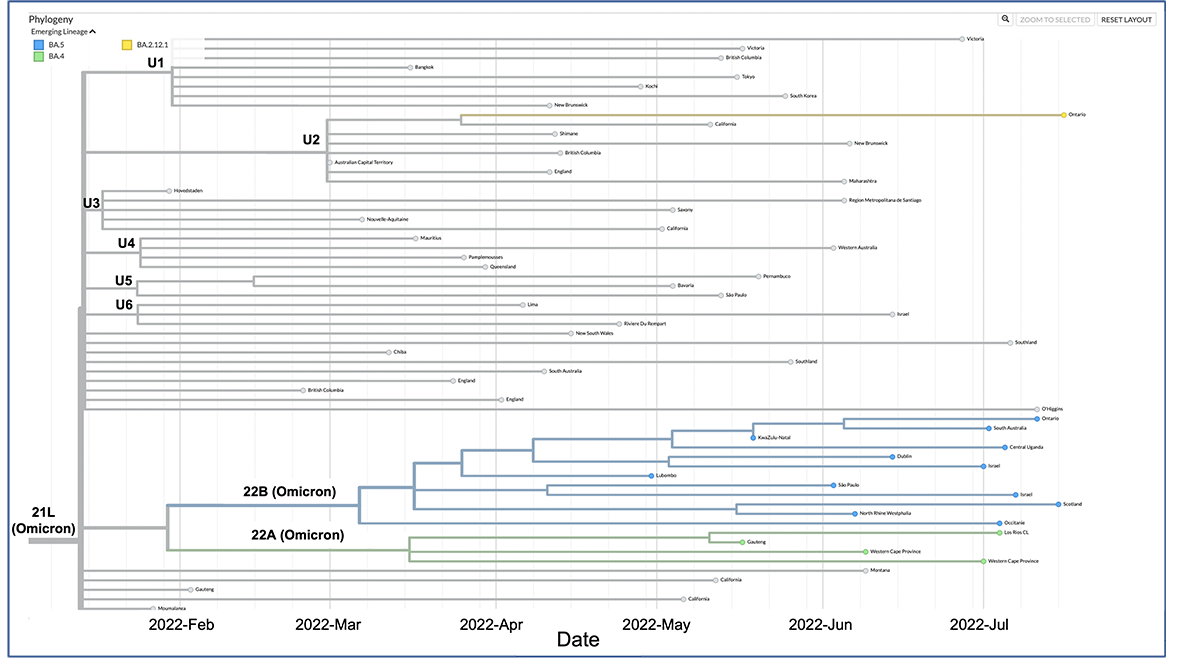
Example tree displaying data with a time scale. The scale reflects sample collection dates and inferred dates of emergence for common ancestors. Based on the time tree, the U3 sublineage was likely the first one to emerge. However, we need to be mindful that this might not be the true picture due to sampling limitations.
Practice reading trees: Genomic epi example
The following examples describe how to interpret trees for genomic epidemiology. Look at the trees to answer questions.
Example 1
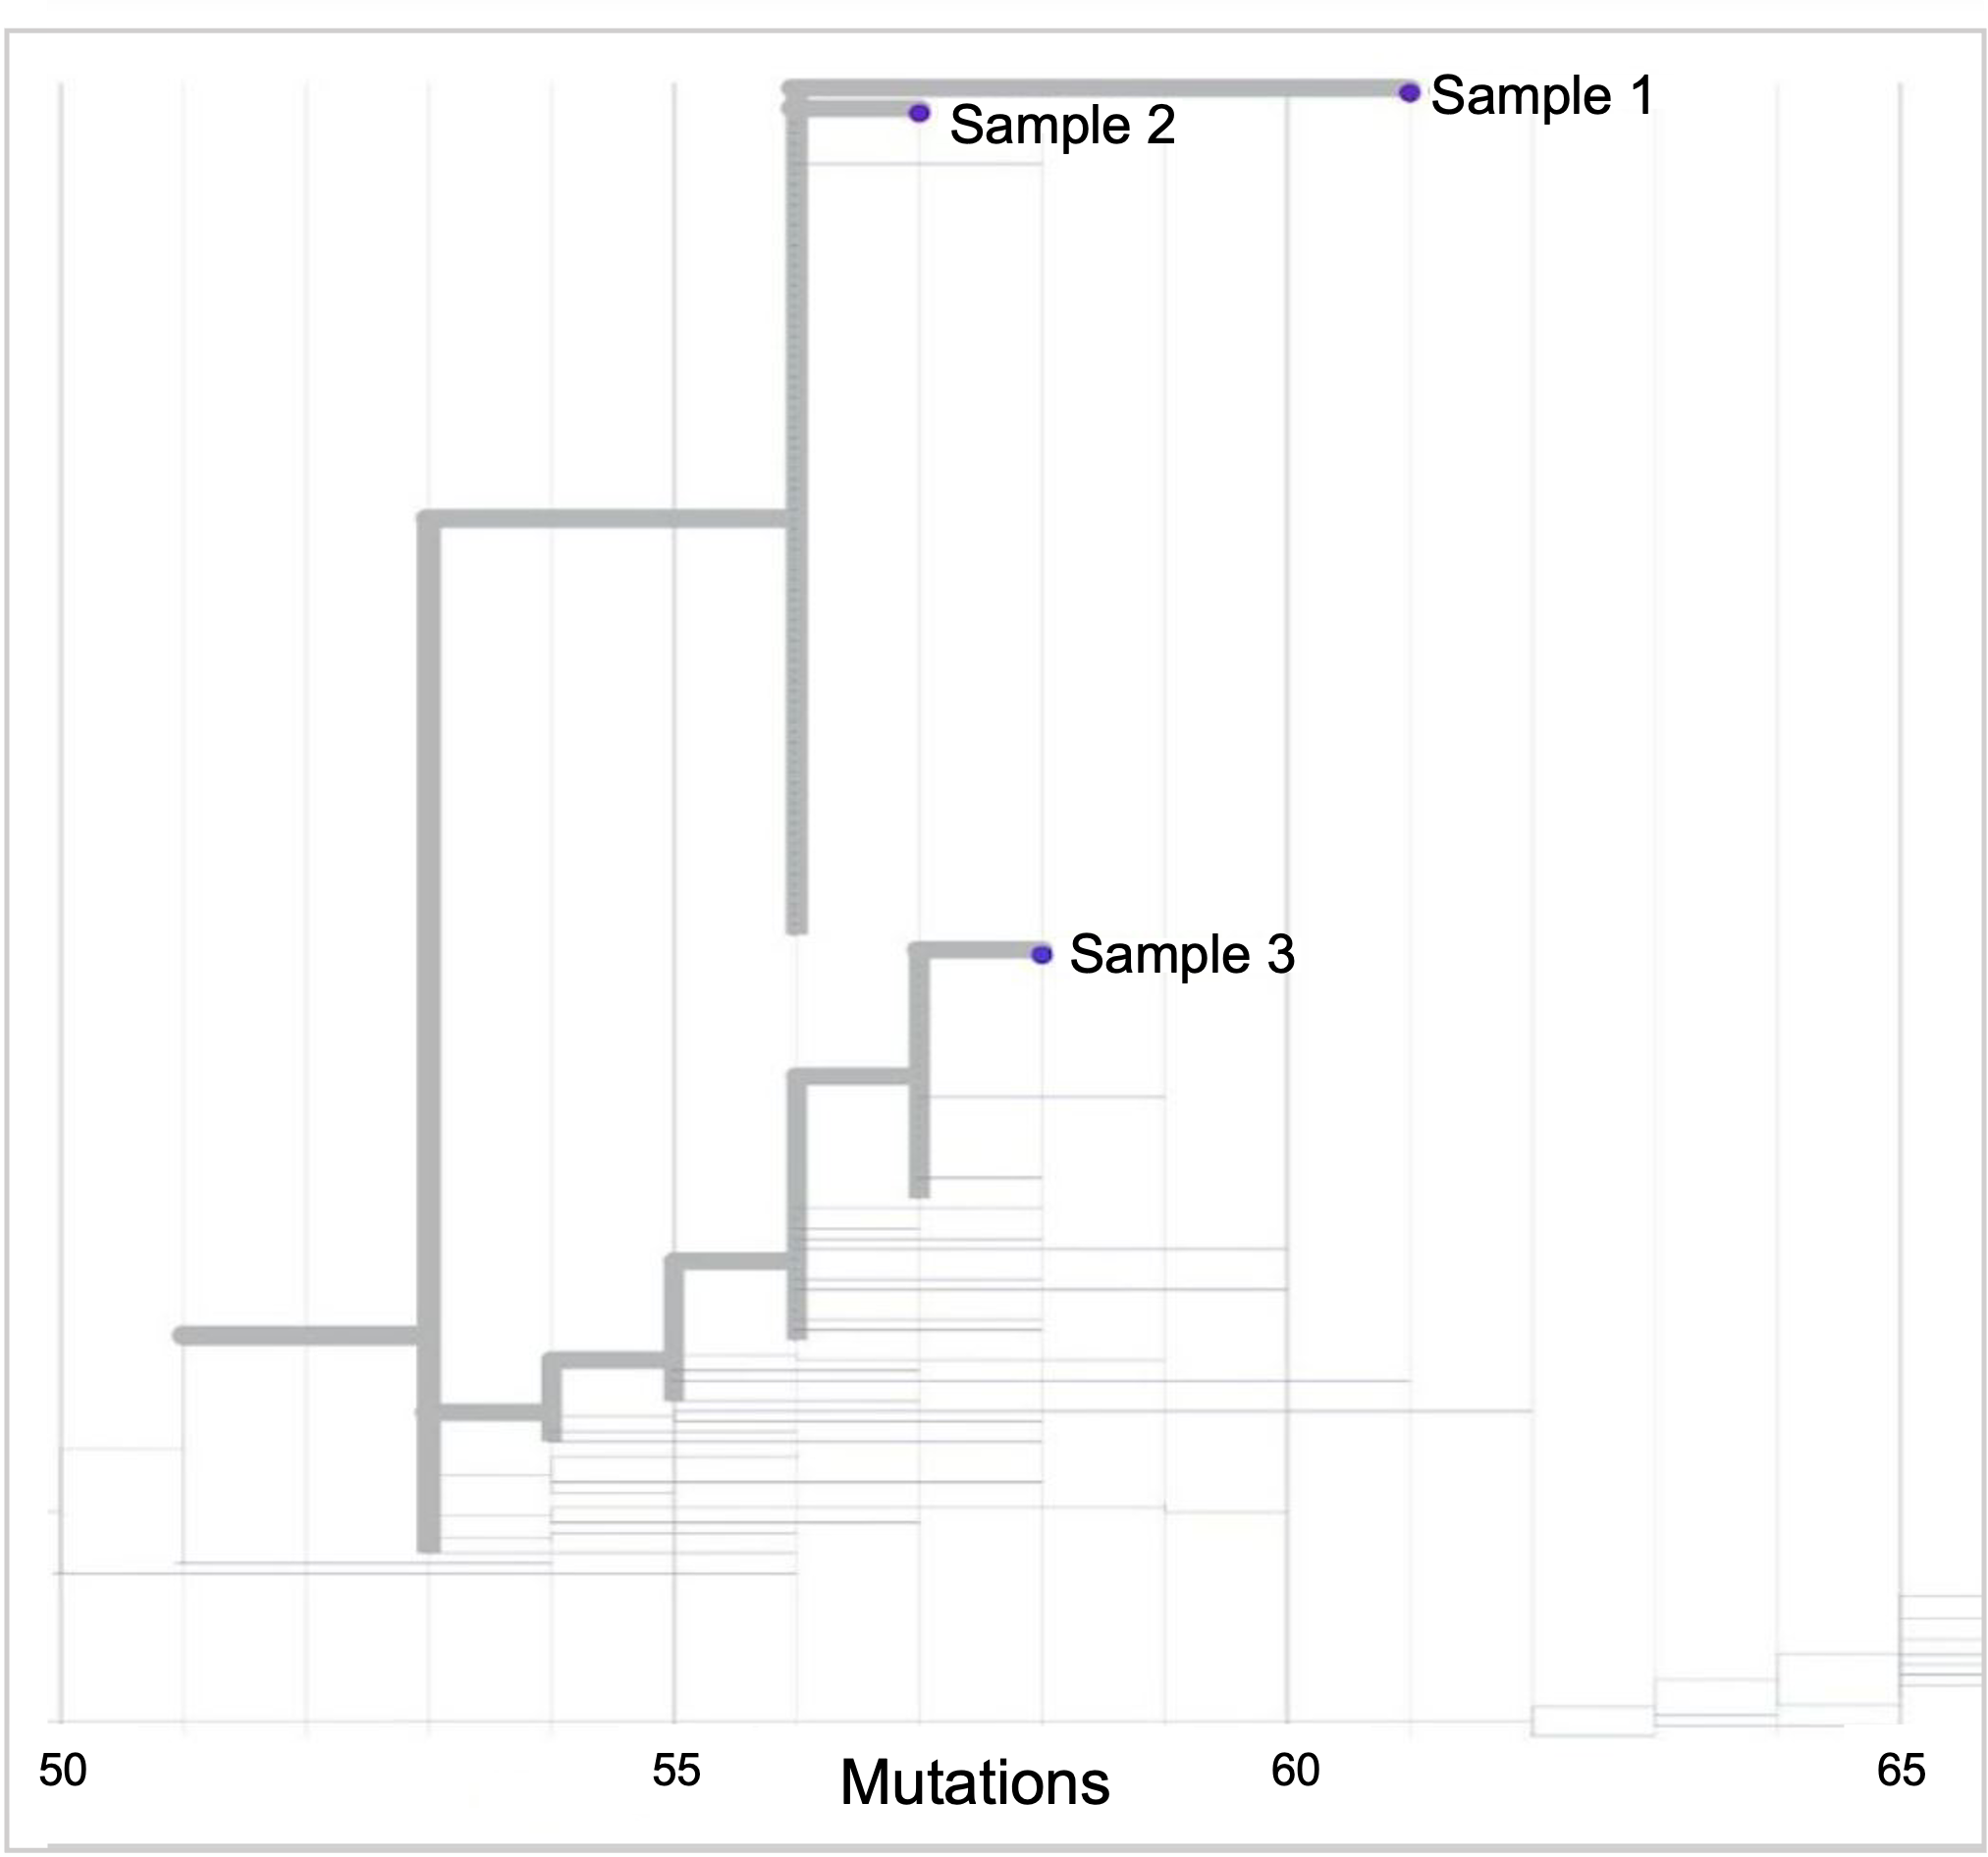
Nextstrain tree highlighting 3 samples
Use the tree example shown above to answer the following:
- What is the divergence between samples 1 and 2?
- Given that the evolutionary rate for SARS-CoV-2 is approximately 26 mutations per year, can you make an educated guess of how much time has passed between samples 1 and 2?
- Based on your answer to question #2, do you think samples 1 and 2 are epidemiologically linked?
Answers:
- What is the divergence between samples 1 and 2? The MCRA for samples 1 and 2 had 56 mutations relative to the reference. When we add mutations relative to the MCRA for sample 1 (61 – 56 = 5) and sample 2 (57 – 56 = 1) we get (5 + 1 = 6). The divergence between samples 1 and 2 are 6 mutations.
- Given that the evolutionary rate for SARS-CoV-2 is approximately 26 mutations per year, can you make an educated guess of how much time has passed between samples 1 and 2? If there are 26 mutations per year, that equals about 2 mutations per month. There are 6 mutations separating samples 1 and 2. It’s reasonable to estimate that 3 months have passed between samples 1 and 2.
- Based on your answer to question #2, do you think samples 1 and 2 are epidemiologically linked? Using this information alone, it is difficult to ascertain if samples 1 and 2 are linked. However, based on the average evolutionary rate for SARS-CoV-2, it seems unlikely that the cases are linked given the long estimated time frame between the two cases.
Example 2

Branch from a Nextstrain tree highlighting 4 samples
Use the tree example shown above to answer the following:
- What is the divergence between samples A through D?
- Given that the evolutionary rate for SARS-CoV-2 is approximately 26 mutations per year, can you make an educated guess of how much time has passed between samples A through D?
- Based on your answer to question #2, do you think samples A through D are epidemiologically linked?
Answers:
- What is the divergence between samples A through D? The divergence is 0. The samples are identical.
- Given that the evolutionary rate for SARS-CoV-2 is approximately 26 mutations per year, can you make an educated guess of how much time has passed between samples A through D? If there are 26 mutations per year, one would expect to see about 2 mutations per month. These samples are identical meaning that less than a month has passed between samples. We can estimate one mutation every 2 weeks. Therefore, it is reasonable to think that anywhere between 0 days and 2 weeks have passed.
- Based on your answer to question #2, do you think samples A through D are epidemiologically linked? Yes! It is possible that samples A through D represent a cluster or potential outbreak, where sampled individuals may have shared the same exposure or transmitted it to each other. However, it is also possible they could have picked it up separately in the community.
Additional resources
To learn more about phylogenetic trees see: