
Overview
Identifying and tracking the mutations in your samples can help you understand the phenotypic impact of mutations circulating in your community. Depending on the pathogen of interest, the TheiaGenEpi mutation report can be used to help you answer a variety of questions.
After reading this guide, you will:
- Understand general use cases for applying the mutation report
Use-Case #1: Tracking mutations and understanding their associated implications for therapeutics and immune escape.
The TheiaGenEpi mutation report can help you track mutations associated with treatment susceptibility or potential immune escape among your samples. It can help answer questions such as:
- ‘I have the following mutations in my SARS-CoV-2 sample; what lineages has this appeared in? Are these mutations associated with reduced susceptibility to certain therapeutics and NTD-binding neutralizing antibodies?’
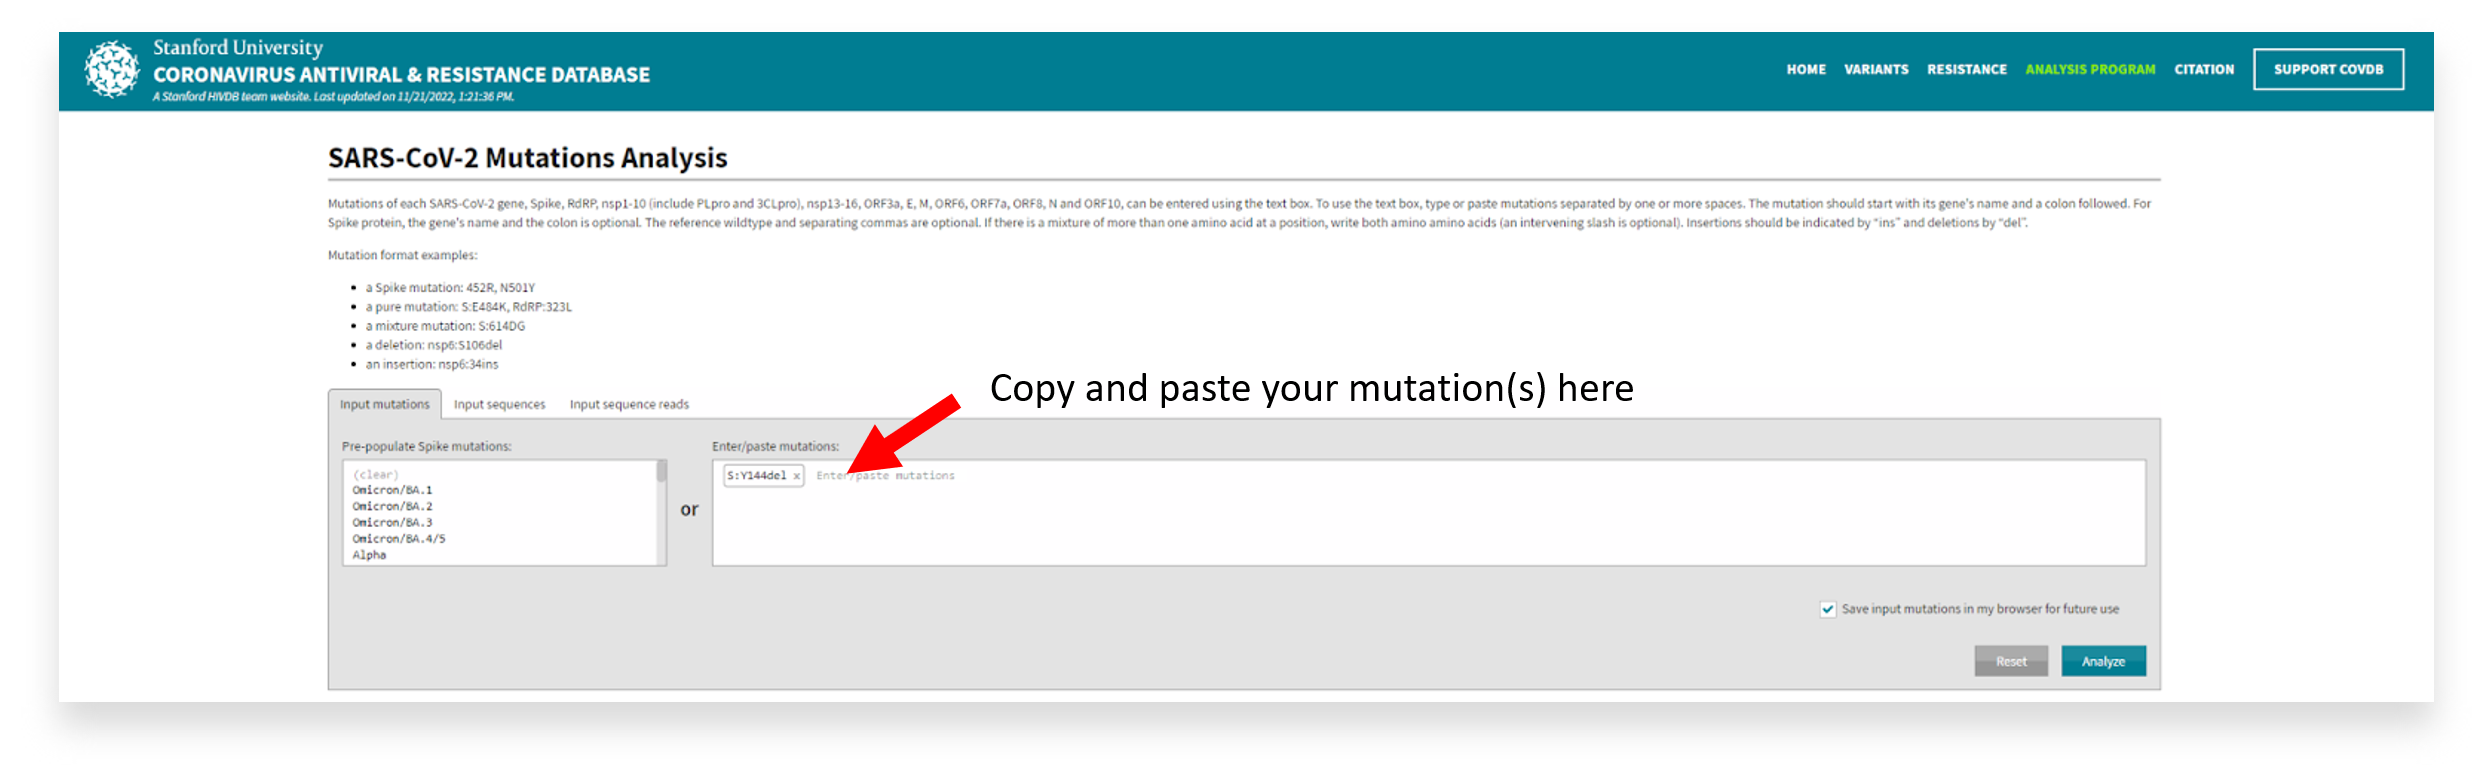
Once you have generated the mutations report, we recommend copying and pasting the substitutions, insertions, or deletions of interest into the Stanford Coronavirus Antivirus and Resistance Database. To do this:
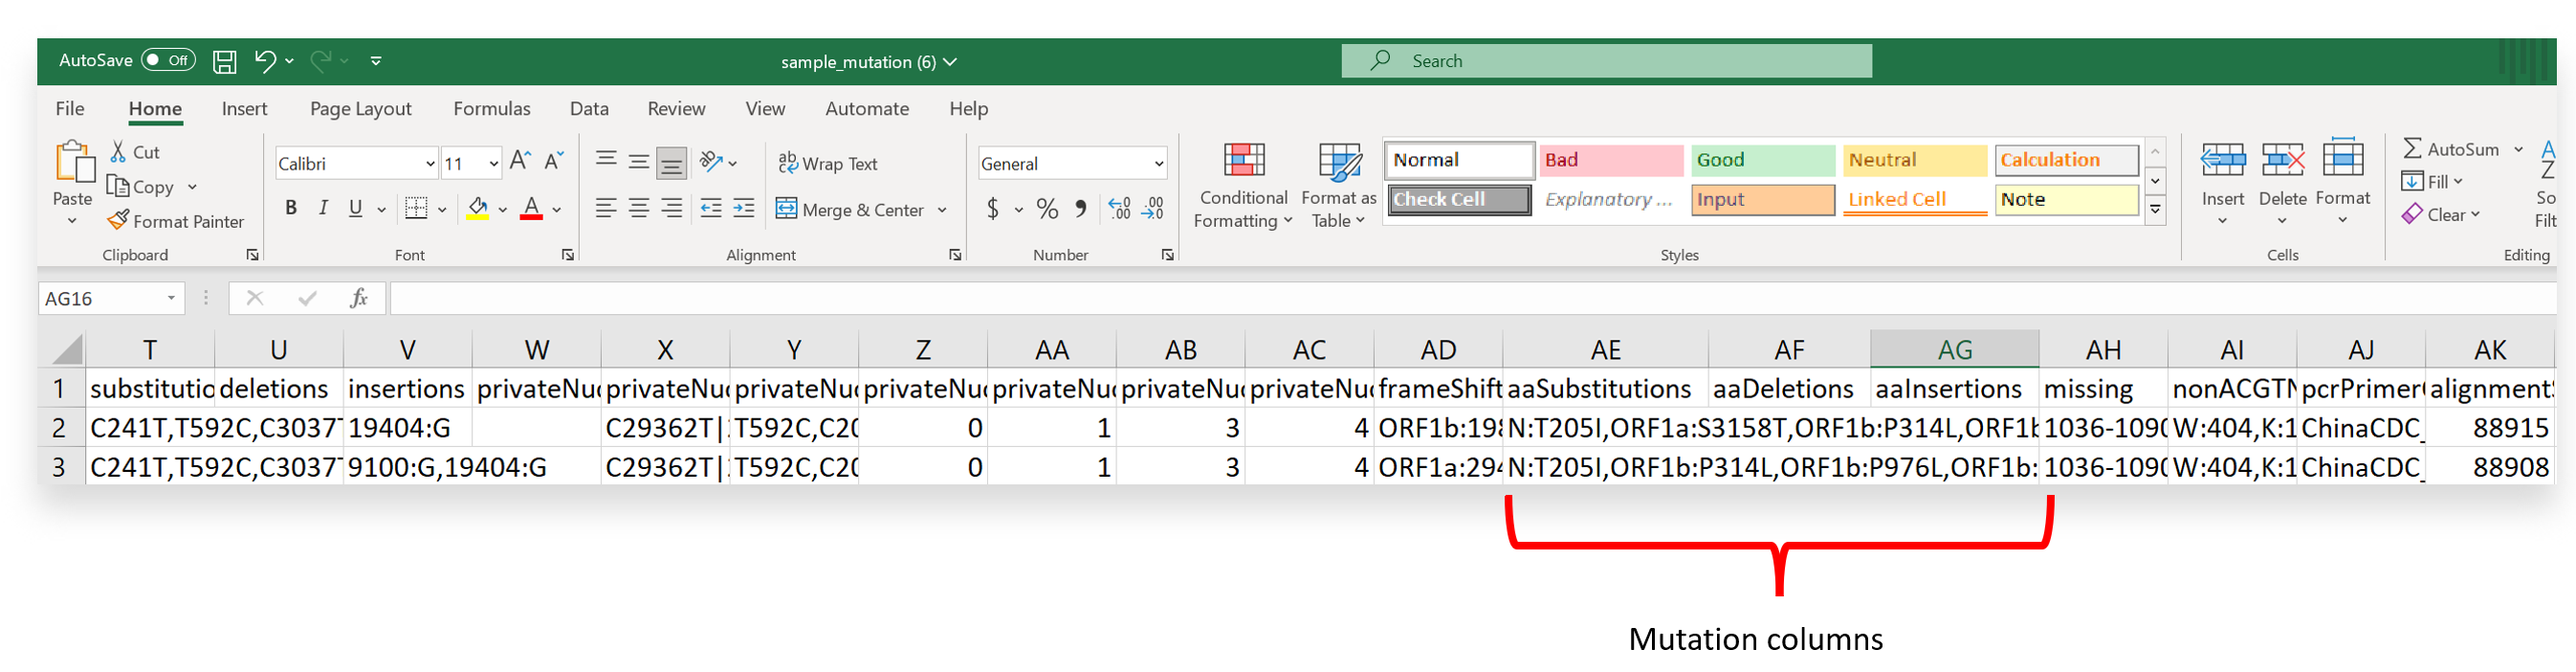
- After downloading the QC metrics and mutation report and importing it into either Excel or a text editor, scroll across the output to view ‘aaSubstitutions,’ ‘aaDeletions, or ‘aaInsertions’ (or columns AE-AG if using Excel).
- Next, identify a mutation of interest from your output. Need help identifying mutations of interest? You can check covSPECTRUM first, which hosts an interactive dashboard for pre-established variants or mutations of interest. Additional knowledge from a literature review or other surveillance data (ex., wastewater) may also help determine mutations of interest.
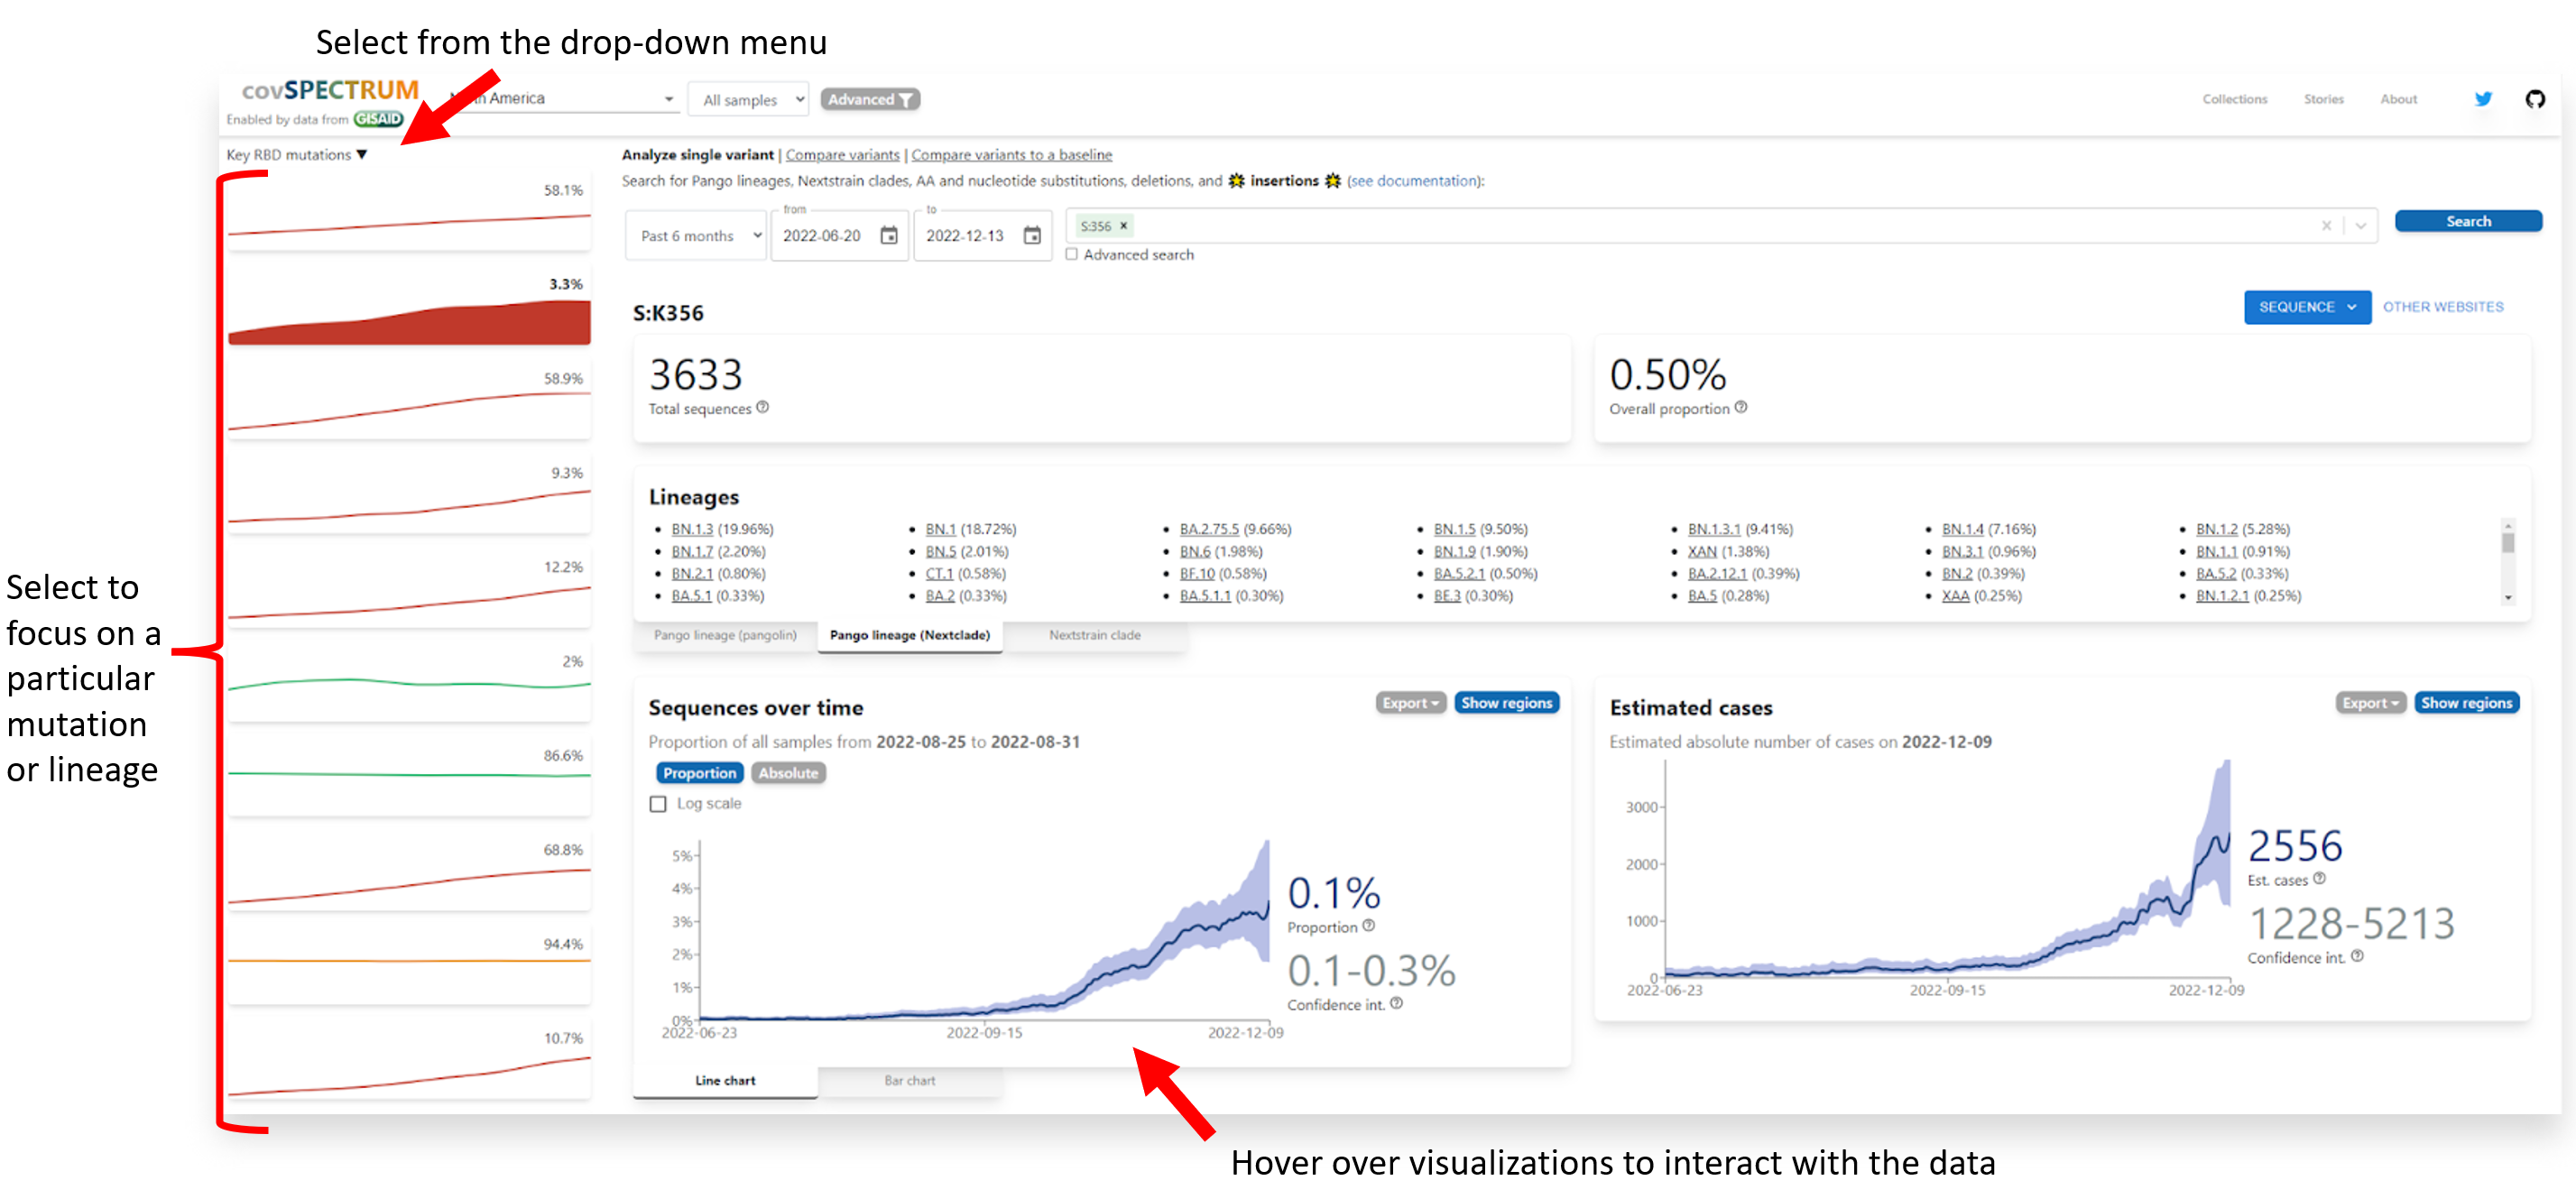 The example above displays the covSPECTRUM dashboard filtered for ‘Key RBD Mutations’ and displays the estimated proportion of sequences with these mutations over time.
 - Once you have identified a mutation of interest in your output, you can copy and paste it into the Stanford Coronavirus Antivirus and Resistance Database via the ‘Input Mutations’ box.
- Then, you can view the sample output to identify the mutation map, quality assessment, and mutation comments (or phenotypic associations) from the literature.
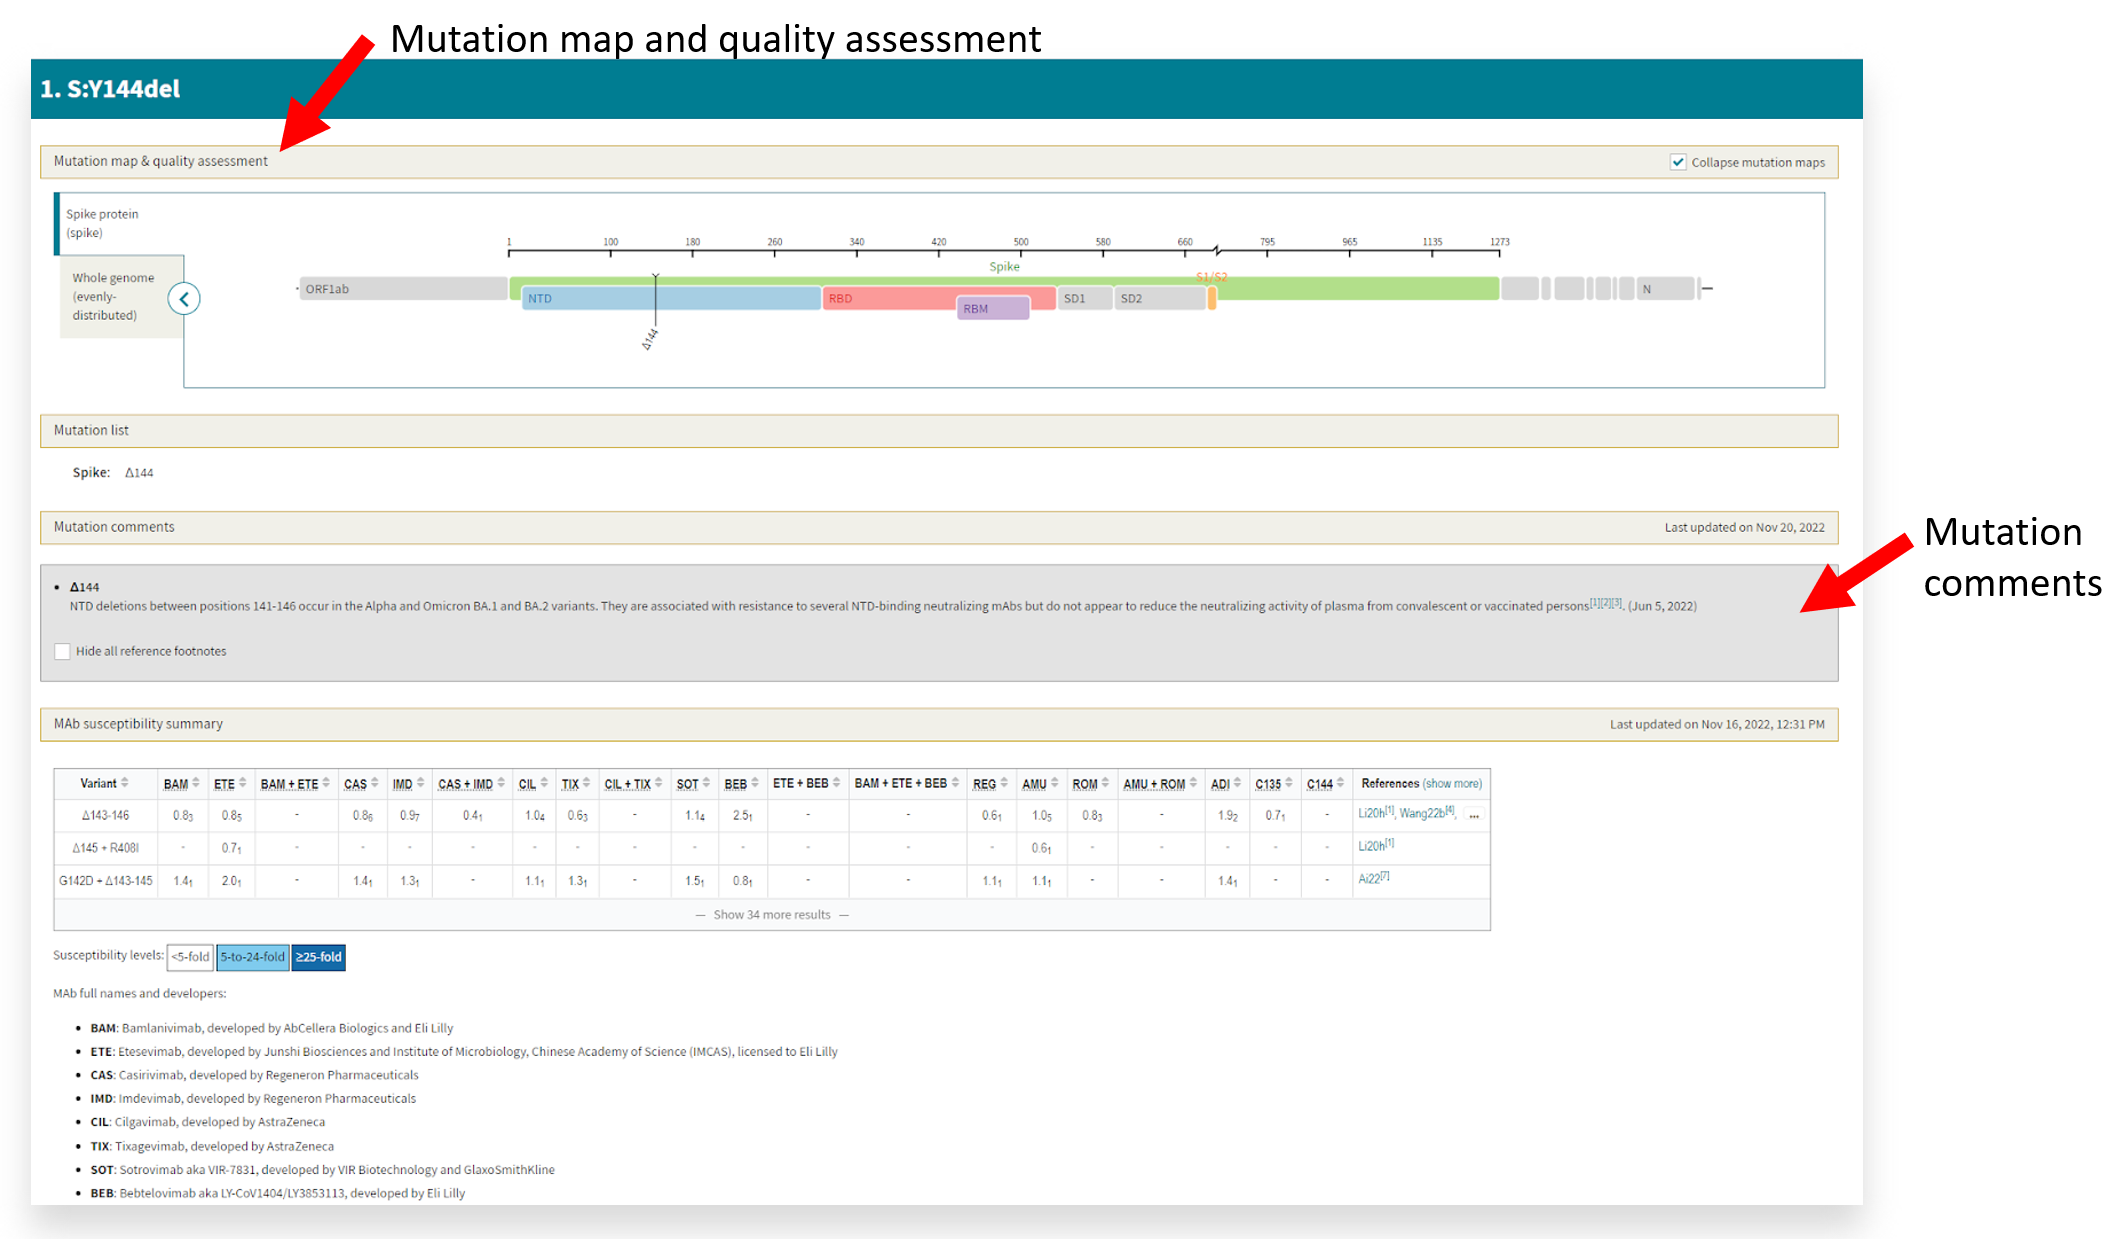 This example displays the Y144del and its location on the NTD of the spike protein, which is common among the Alpha and Omicron BA.1 and BA.2 variants. Per the cited references, this deletion is associated with immune evasiveness.
 - If you are interested in more than one mutation or the entire fasta file, you can copy and paste from the mutation report or upload the fasta file(s) for a more extensive analysis.
Use-Case #2: Tracking mutations and understanding their associated implications for testing.
The TheiaGenEpi mutations report can help you identify mutations that may impact diagnostic testing or reduce primer effectiveness. In combination with other tools and online resources, it can help you answer questions such as:
- ‘Are there any variants in my jurisdiction that may impact testing or my sequencing efforts? If so, which tests or primer sets?’
- ‘How can I track the prevalence or frequency of particular mutations or variants circulating in my community, so I know when to adjust my protocol?’
We recommend monitoring the GISAID PMT dashboard first and then tracking the prevalence of mutations in the mutation report. To do this:
- Start by checking the GISAID PMT Primer Variant Summary dashboard and adjusting the primer set options based on the library preparation protocol used to sequence your samples. You may also adjust the ‘Geographic Detail Level’ to match your sampling scheme.
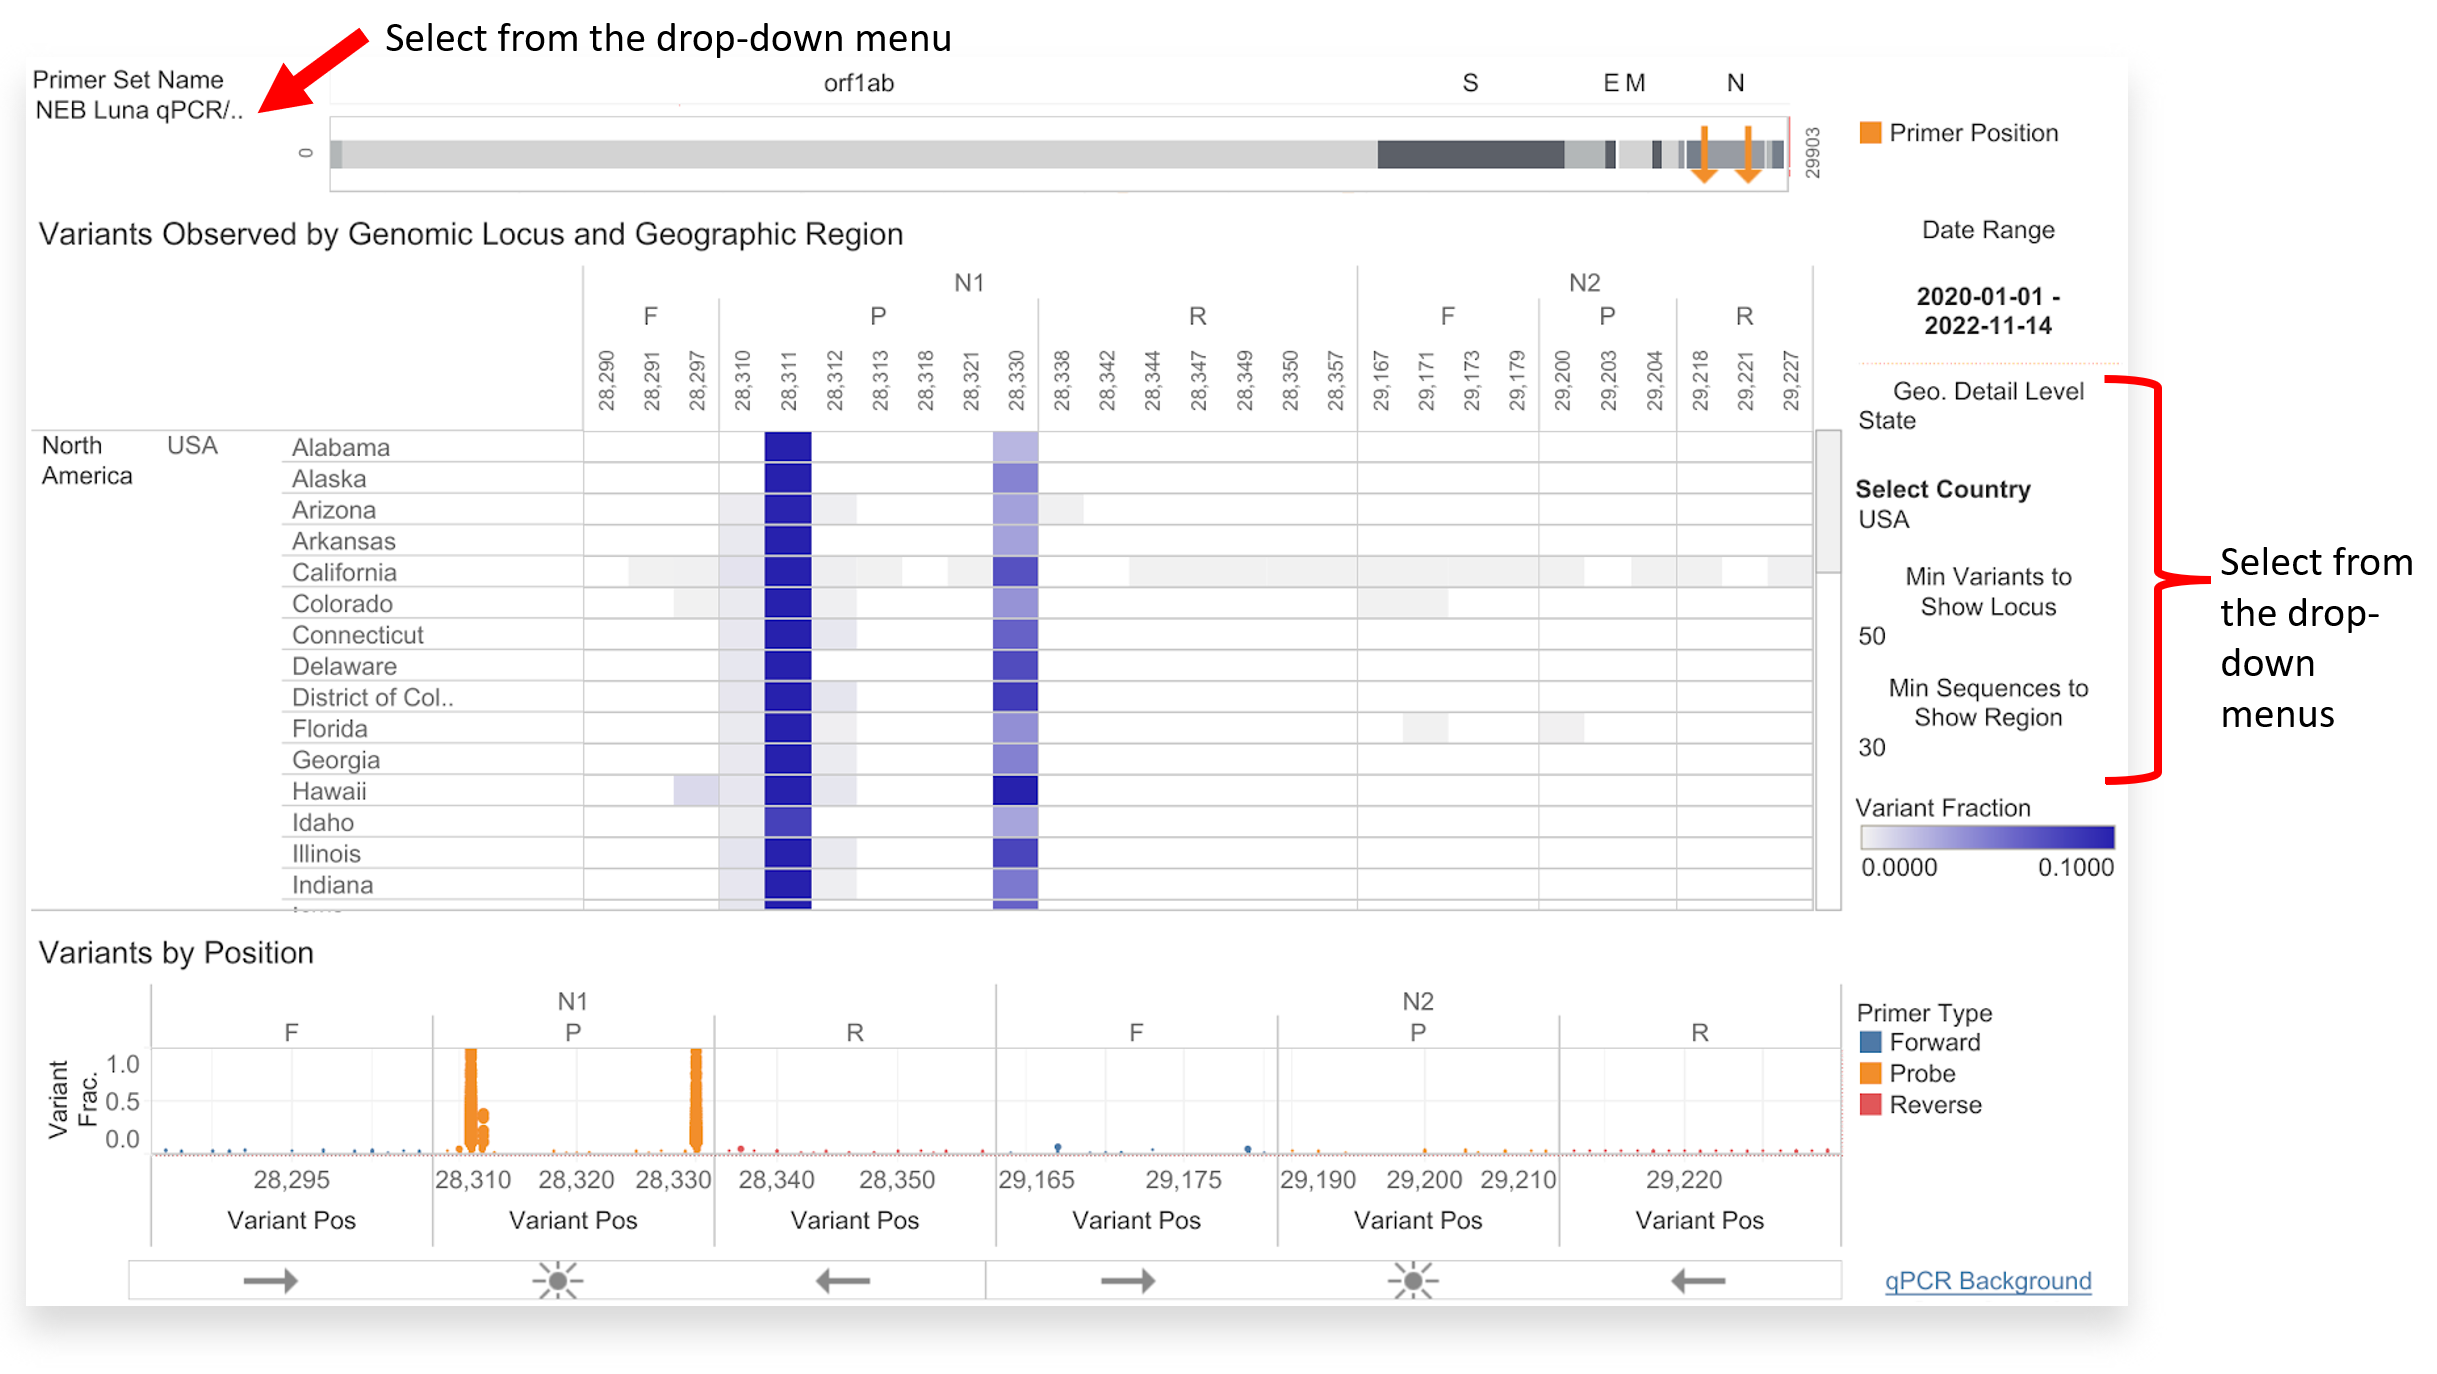 You can adjust the GISAID PMT dashboard based on your library preparation protocol, geographic location of interest, and minimum display criteria. In the example above, there is sufficient coverage between the orange primer positions at N1 and N2 for the NEB Luna qPCR/CDC protocol in the USA. Read this for more information on identifying where primer assessment might be warranted.
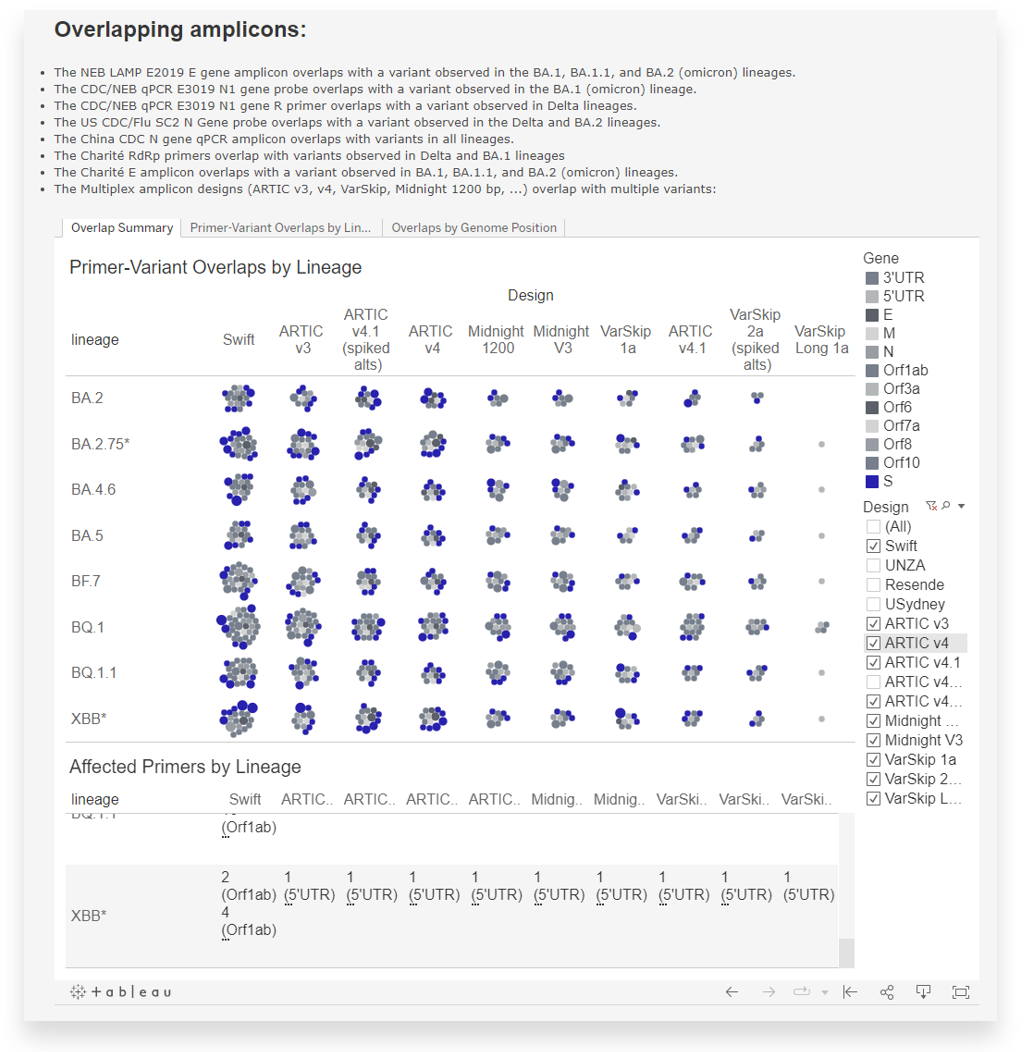
 - You can also start by checking the GISAID PMT Lineage Variants interactive dashboard to identify amplicons overlapping with mutations identified in known variants of concern.
- Once you have identified a mutation of concern that overlaps with your primer set or amplicon design, you can return to TheiaGenEpi and download the QC metrics and mutation report for your samples.
- You can search for the particular mutation by scanning through ‘aaSubstitutions,’ ‘aaDeletions,’ or ‘aaInsertions’ (columns AE-AG) or by creating various visualizations to track the prevalence in your community or dataset. You can do this in Excel or another data analysis software like R Studio. For more information, see this article.
- Within GISAID PMT, you can set an alert to be notified about variants observed within a particular timeframe or at a particular prevalence level across GISAID data under user details and subscriptions.
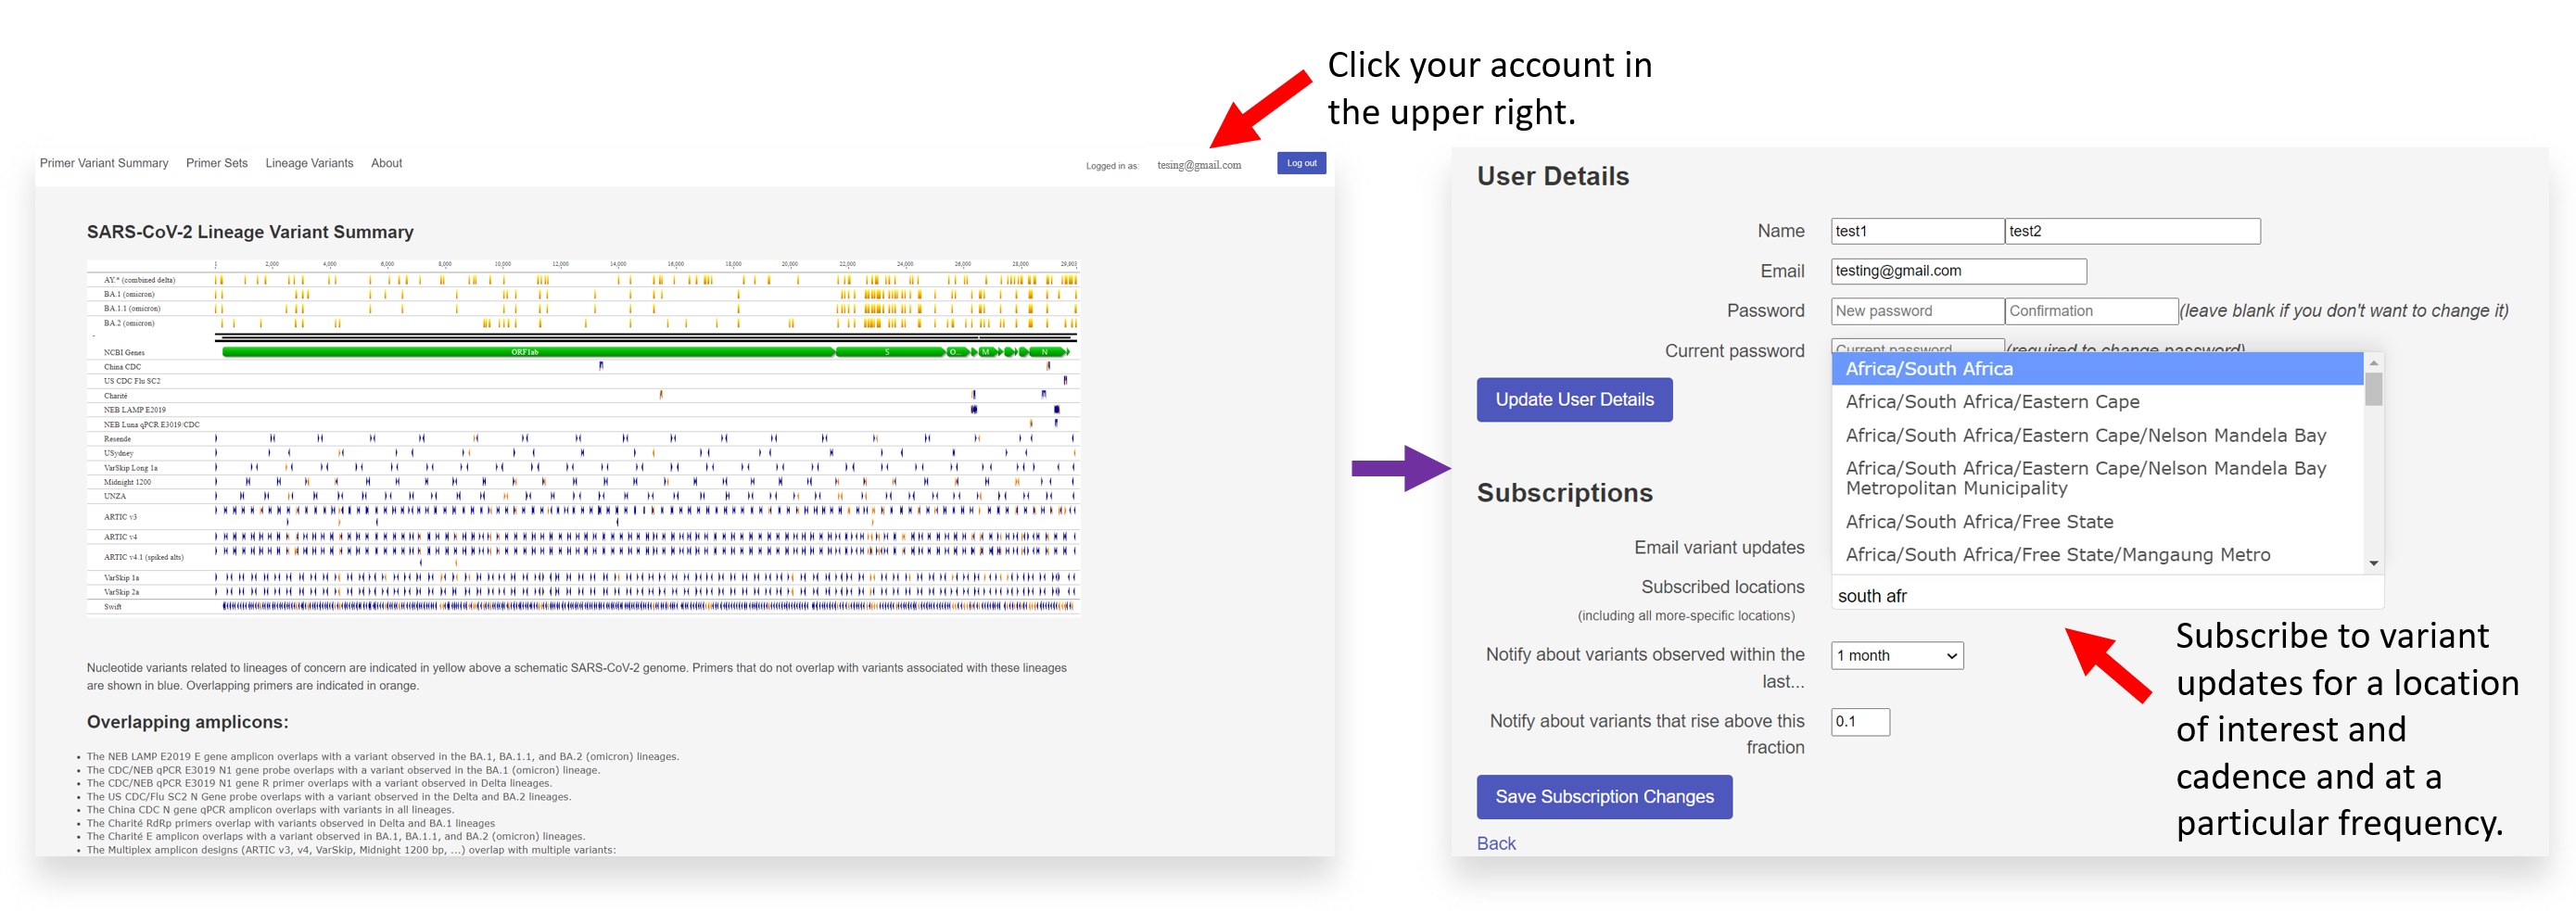
Once you have logged into your account on GISAID PMT, click on your profile in the upper right-hand corner. Beneath ‘User Details,’ you can subscribe to email variant updates and primer sets.