Overview
In this “Epi Insights” user guide series we walk you through examples of genomic epidemiology investigations. The series includes four parts that highlight topics relevant to applying genomic epidemiology to public health. For each topic, you will read through scenarios organized into three levels of difficulty as it relates to phylogenetic data interpretation for outbreak investigations, including:

- Straightforward: The interpretation of phylogenetic trees and its application in public health is straightforward and definitive. Additional surveillance data are not as important for interpretation. This type of scenario might be less common in real life.
- Nuanced: Phylogenetic trees often lead to more than one possible interpretation in public health investigations. This scenario highlights the kinds of insights phylogenetic data can provide (even if not definitive) and how additional information, such as understanding your sampling frame, can change your tree interpretation.
- Challenging: Accurately interpreting phylogenetic trees during public health investigations requires that multiple principles are met. This type of scenario takes the nuanced interpretations a step further to help outline the limitations of genomic epidemiology due to data quality issues or unmet assumptions.
Here we discuss Part I of the series which deals with how to evaluate potential epidemiological links between COVID-19 cases. After reading this user guide, you will:
- Become familiar with epidemiological-linkages
- Practice how to interpret data to evaluate potential epidemiological-linkages between cases
How can we use genomic epidemiology to evaluate epidemiological-linkage?
During an outbreak investigation, it is important to understand where and how transmission is occurring between cases. We can evaluate the relatedness of cases using genomic data. This is possible because viruses accumulate changes or mutations in their genomes as they replicate within the host and then infect other individuals. Note that a virus will mutate while replicating within a given host or individual independent of whether or not it’s transmitted to another individual. However, the more a virus replicates and transmits between individuals over the course of an outbreak, the more likely mutations accrue in the consensus genomes we sequence. Therefore, consensus genomes sampled from closely linked cases are more likely to be genetically similar than those sampled from cases that are separated by a large number of transmission events.
Let’s further explore the concept of accumulated mutations by looking at the probability distribution of whether two cases are directly linked provided within the Applied Genomic Epidemiology Handbook. When looking at the plot shown below, you will notice that as the number of mutations separating sequences increases, the probability that cases are linked decreases toward zero.
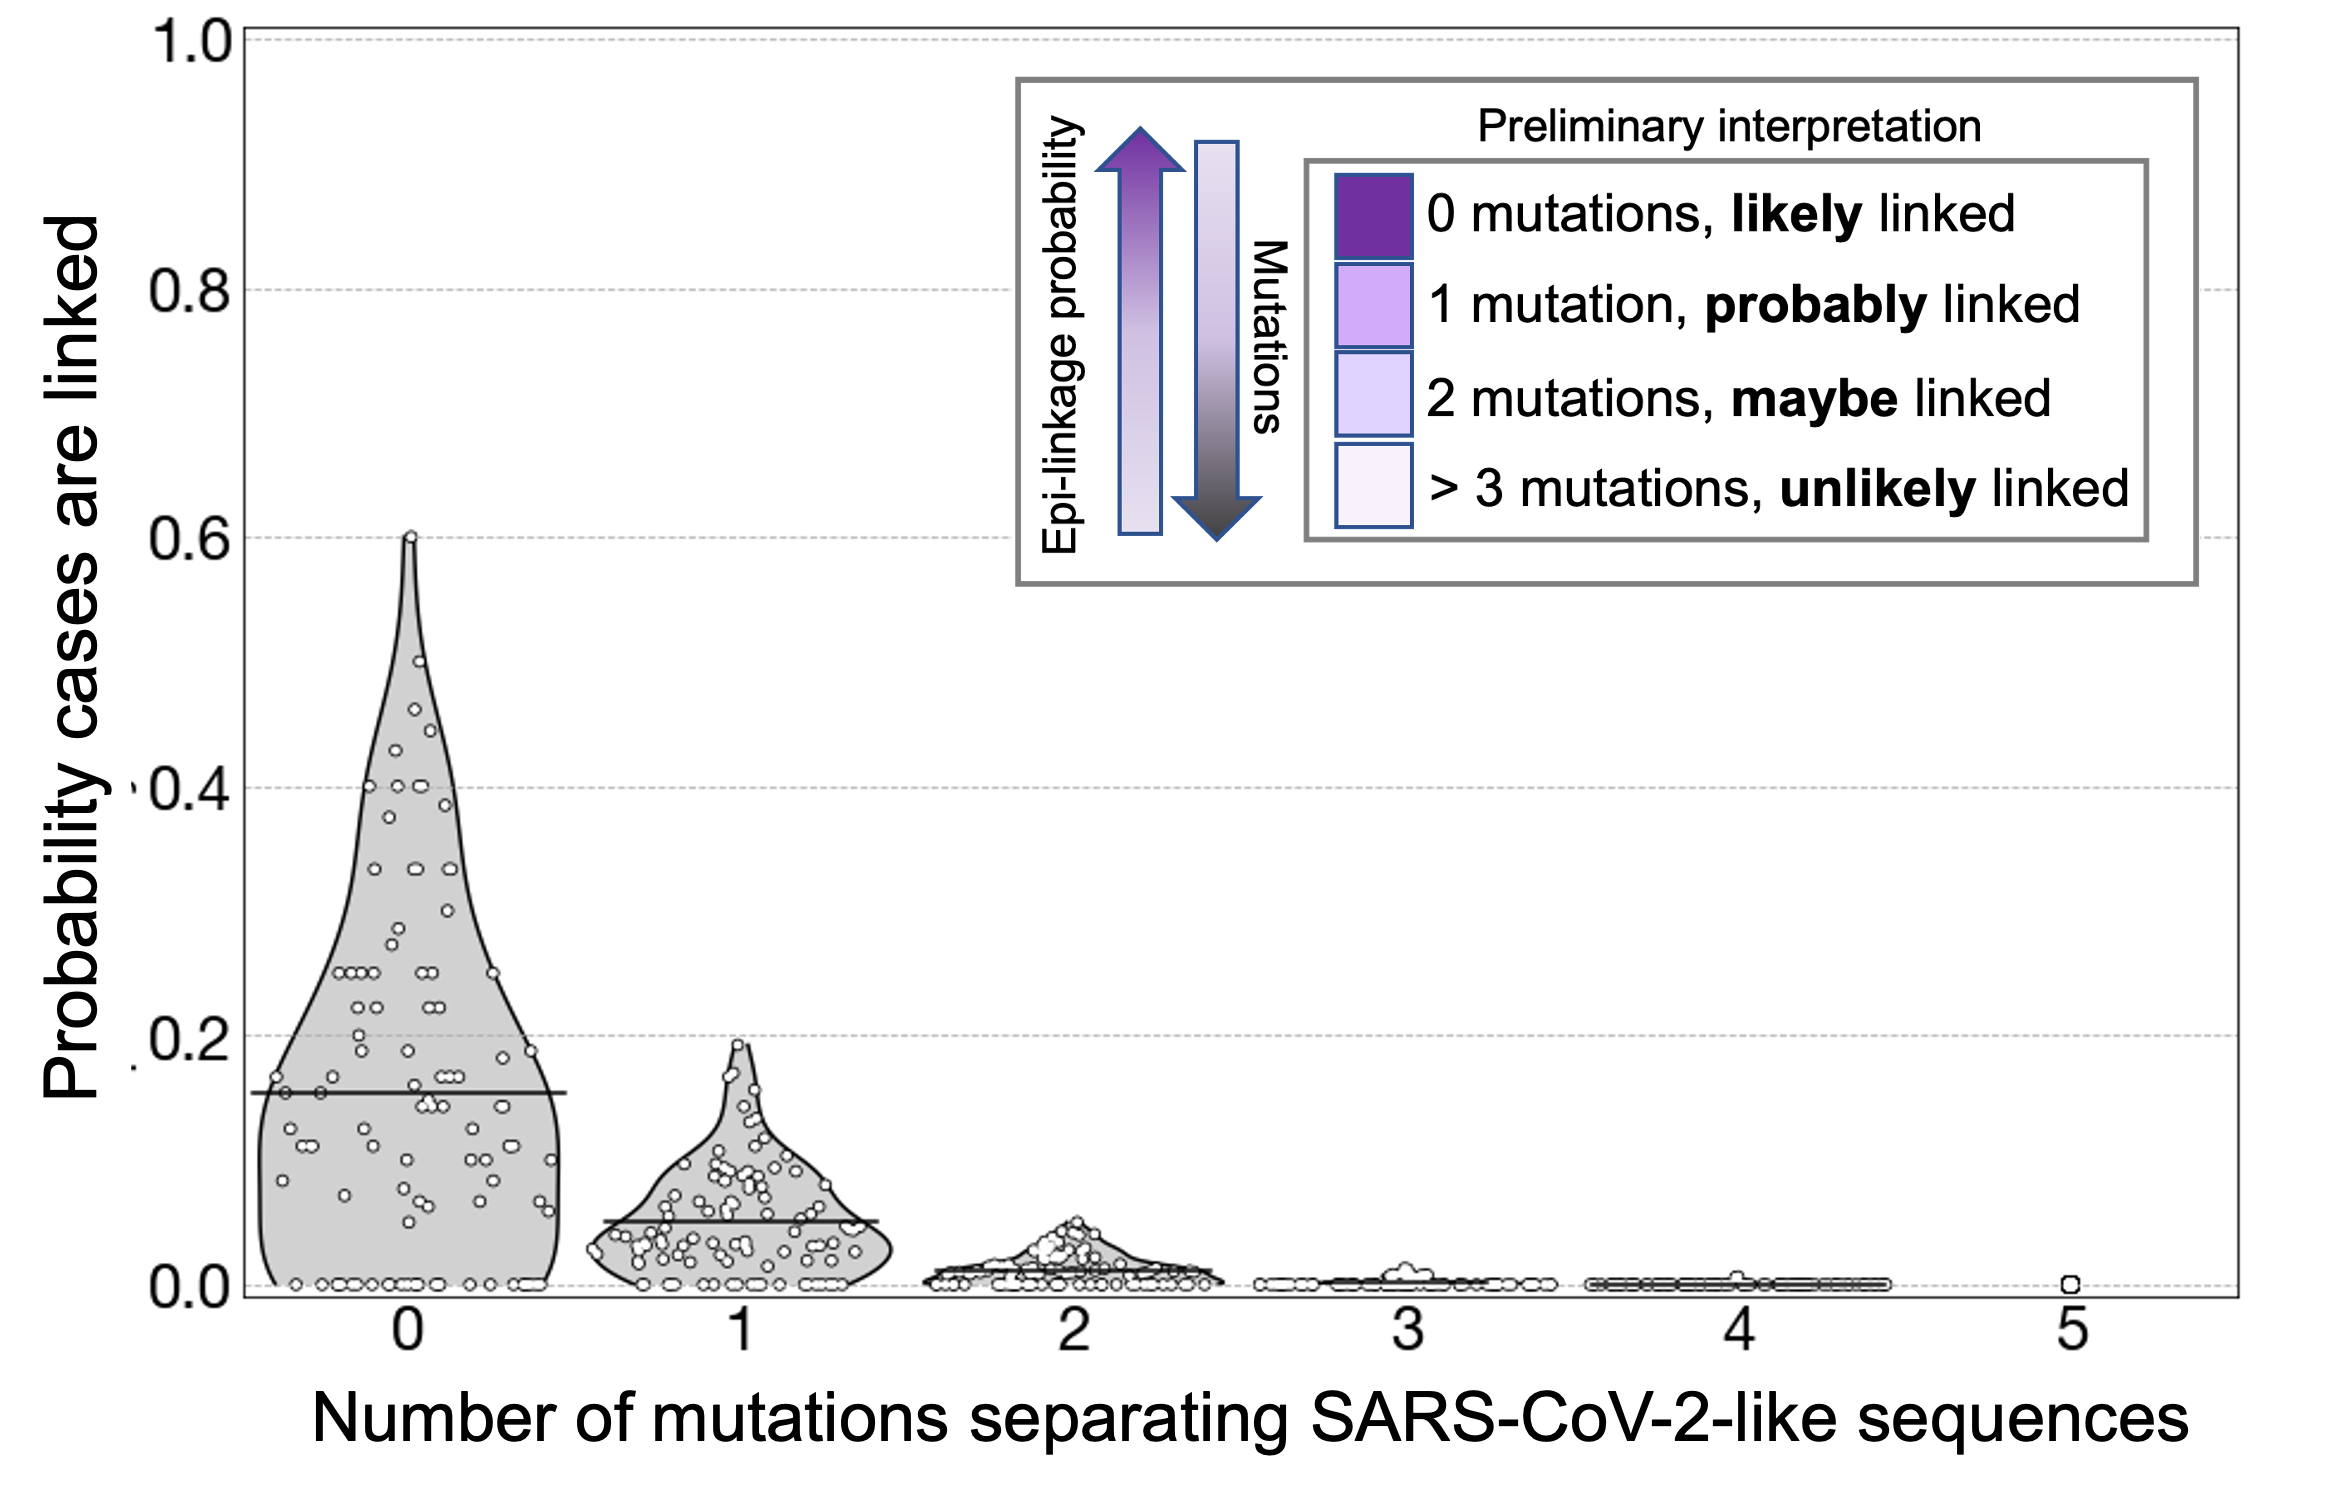
Plot showing the probability distribution for epidemiological linkage between cases using parameters that mirror SARS-CoV-2 sequences. As the number of mutations separating sequences increases, the probability that cases are linked decreases toward zero. See How many mutations are enough to rule linkage out? for more information and a detailed explanation of the plot. Insert on the top right of the plot summarizes the inverse relationship between epidemiological (epi)-linkage probability and number of mutations as well as preliminary interpretations one can draw from genetic distances between samples.
This basic principle enables the use of phylogenetic analyses to assess potential links between cases given that phylogenetic trees provide a visual summary of the genetic or genomic similarity between samples of interest. The rate of genetic change or how fast mutations are accumulated per transmission event is an important consideration to understand pathogen spread and distribution through phylogenetic trees. When the rate at which mutations are observed (also known as the evolutionary rate) within a virus population roughly equals its transmission rate, we can use phylogenetic data to understand virus transmission dynamics and evaluate potential linkages between cases.
Here we provide example scenarios to identify and evaluate potential links between COVID-19 cases. Note that any question trying to answer if cases represent the same exposure or direct transmission chain fall under this topic.

Practice example: Identifying epi-linkages at Smarty-Pants University
As an epidemiologist for Know-it-All County, you are in charge of keeping track of COVID-19 reports within educational institutions in the jurisdiction. Below are a few scenarios that you need to investigate from Smarty-Pants University. Your job is to assess if there is SARS-CoV-2 transmission happening on campus (is there an outbreak?) or if the reported cases potentially represent community- or travel-acquired infections outside the university. Scenarios are listed in the sections below in order of difficulty.
Straightforward Scenario
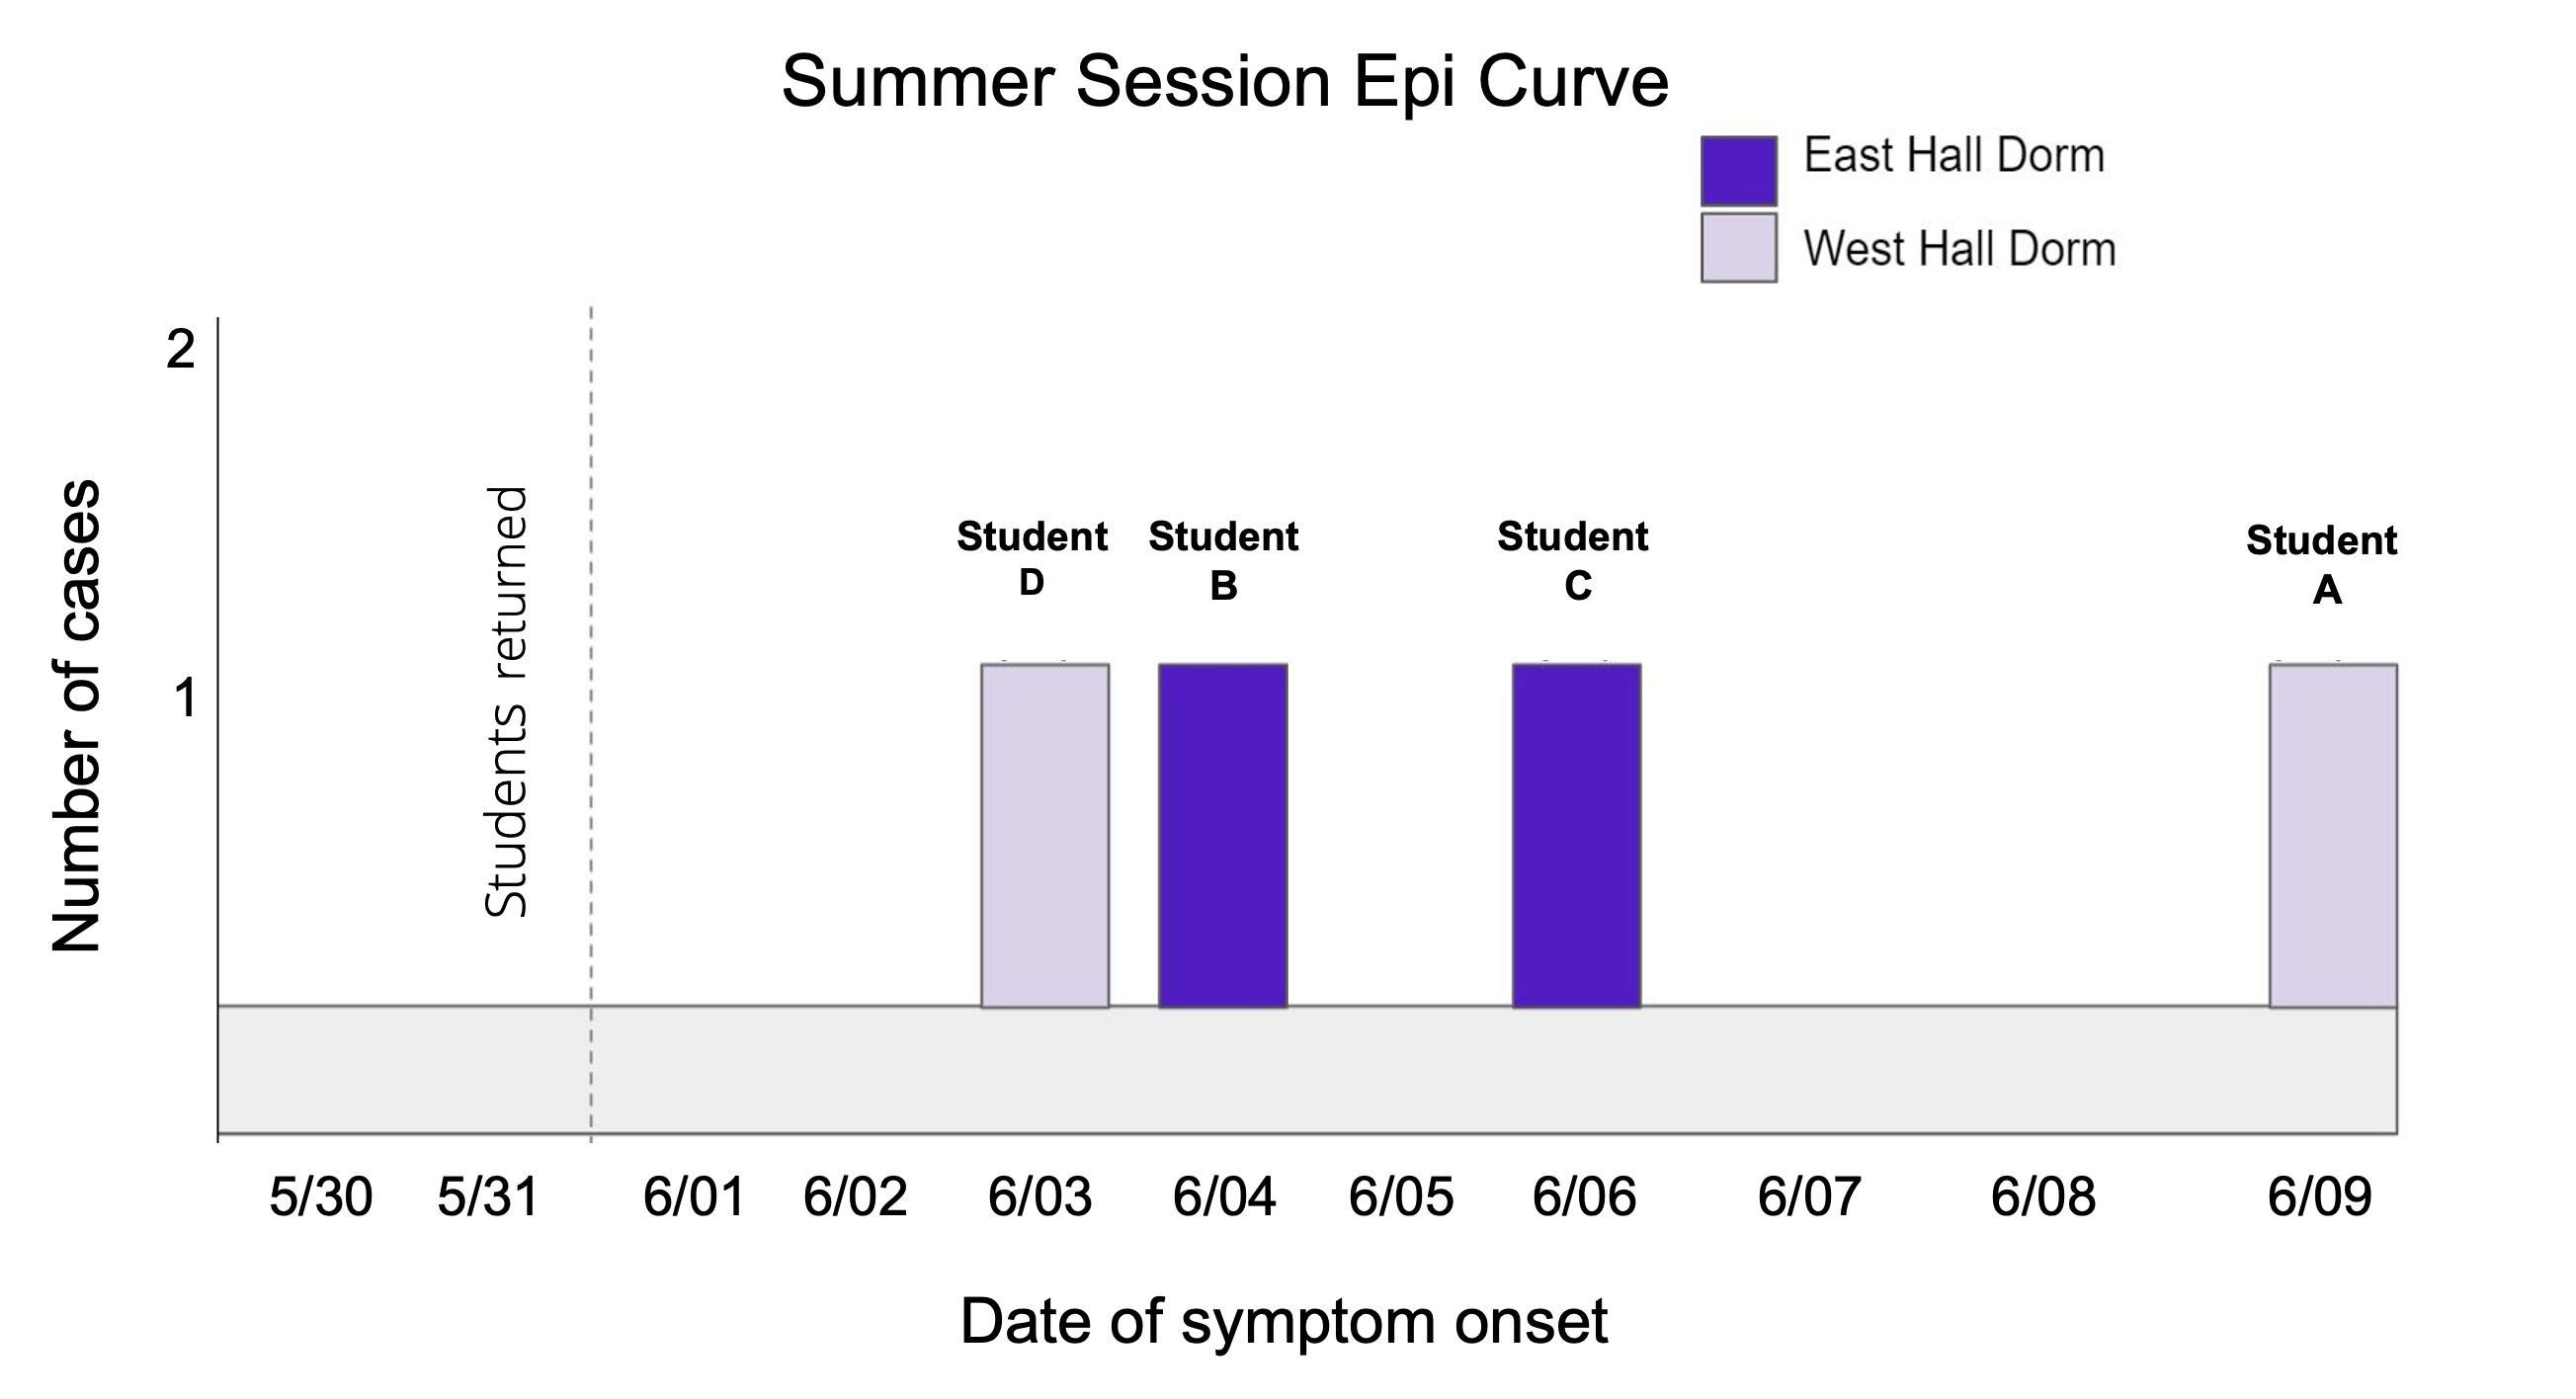
As college students are returning from their study abroad trips in June 2021, you observe an uptick in COVID-19 cases reported from Smarty-Pants University. However, it is unclear if these cases are related to one another.
There are four students that have reported COVID-19 symptoms and were tested for SARS-CoV-2 at the time of symptom onset.
![]()
You need to know as soon as possible if the reported cases so far represent the beginning of an outbreak. You decide to create a targeted phylogenetic tree to help identify or rule out epi-linkages between students and evaluate if there is transmission happening on campus. The targeted tree will allow you to identify and examine samples most closely related to the student samples.
![]()
When exploring the resulting targeted tree, you immediately notice that the samples collected from the four students do not fall within the same clade and are highly genetically diverged from one another.
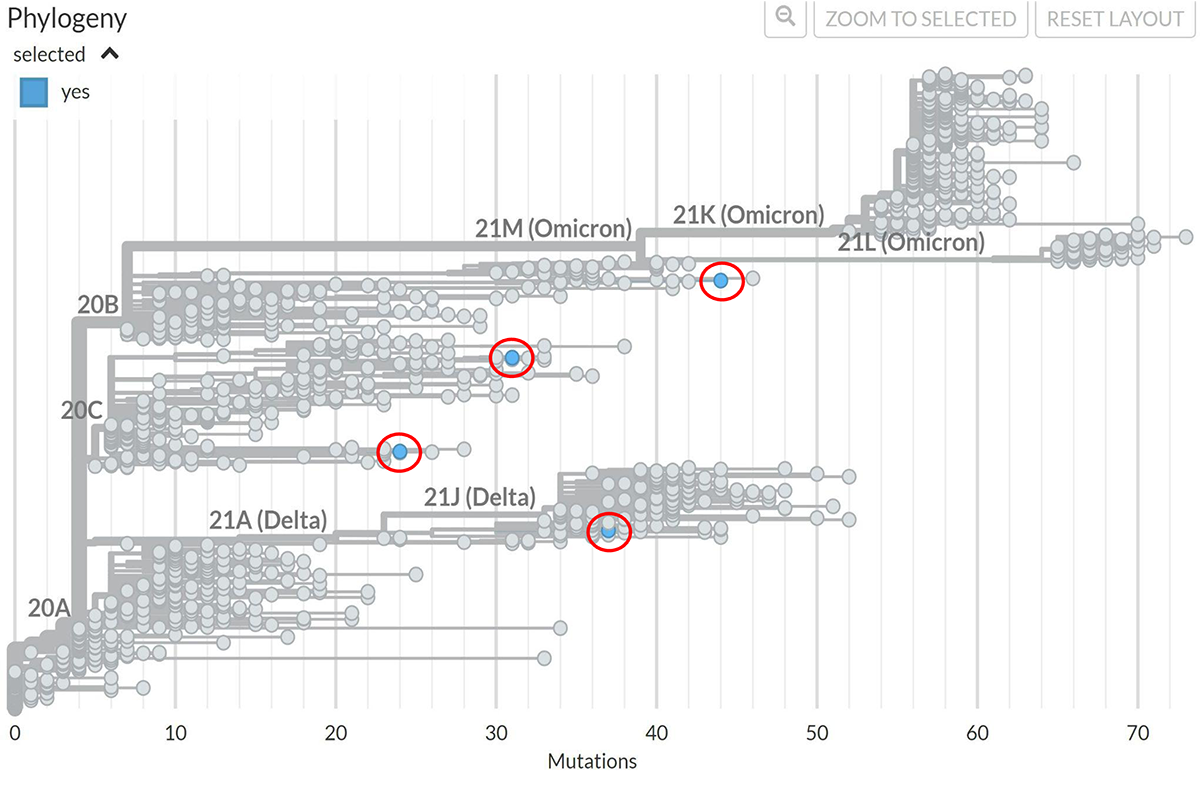
Targeted tree showing the samples from the four students (blue branch tips highlighted with red circles) and closely related samples.
Things to notice from the targeted tree:
- Samples are separated by over 40 mutations despite the fact that they were collected within 7 days of each other. You know that the SARS-CoV-2 genome accumulates roughly two mutations per month and, thus, these samples do not seem to be linked.
![]()
What are these student samples more closely related to? You decide to further explore the targeted tree and look at the IDs of samples most closely related to samples from each student.

Targeted tree highlighting the location where the most closely related samples to the student samples were collected.
Things to notice from the tree showing sample locations:
- None of the student samples are closely related to samples from a single location.
![]()
Based on phylogenetic data, student samples do not appear to represent local transmission at the university despite the close symptom onset timeline. Given that three out of the four locations match the study abroad destination for students, it is possible that these cases represent travel-acquired infections. Continued testing is recommended to ensure that each of the detected variants do not spread further.
Nuanced scenario
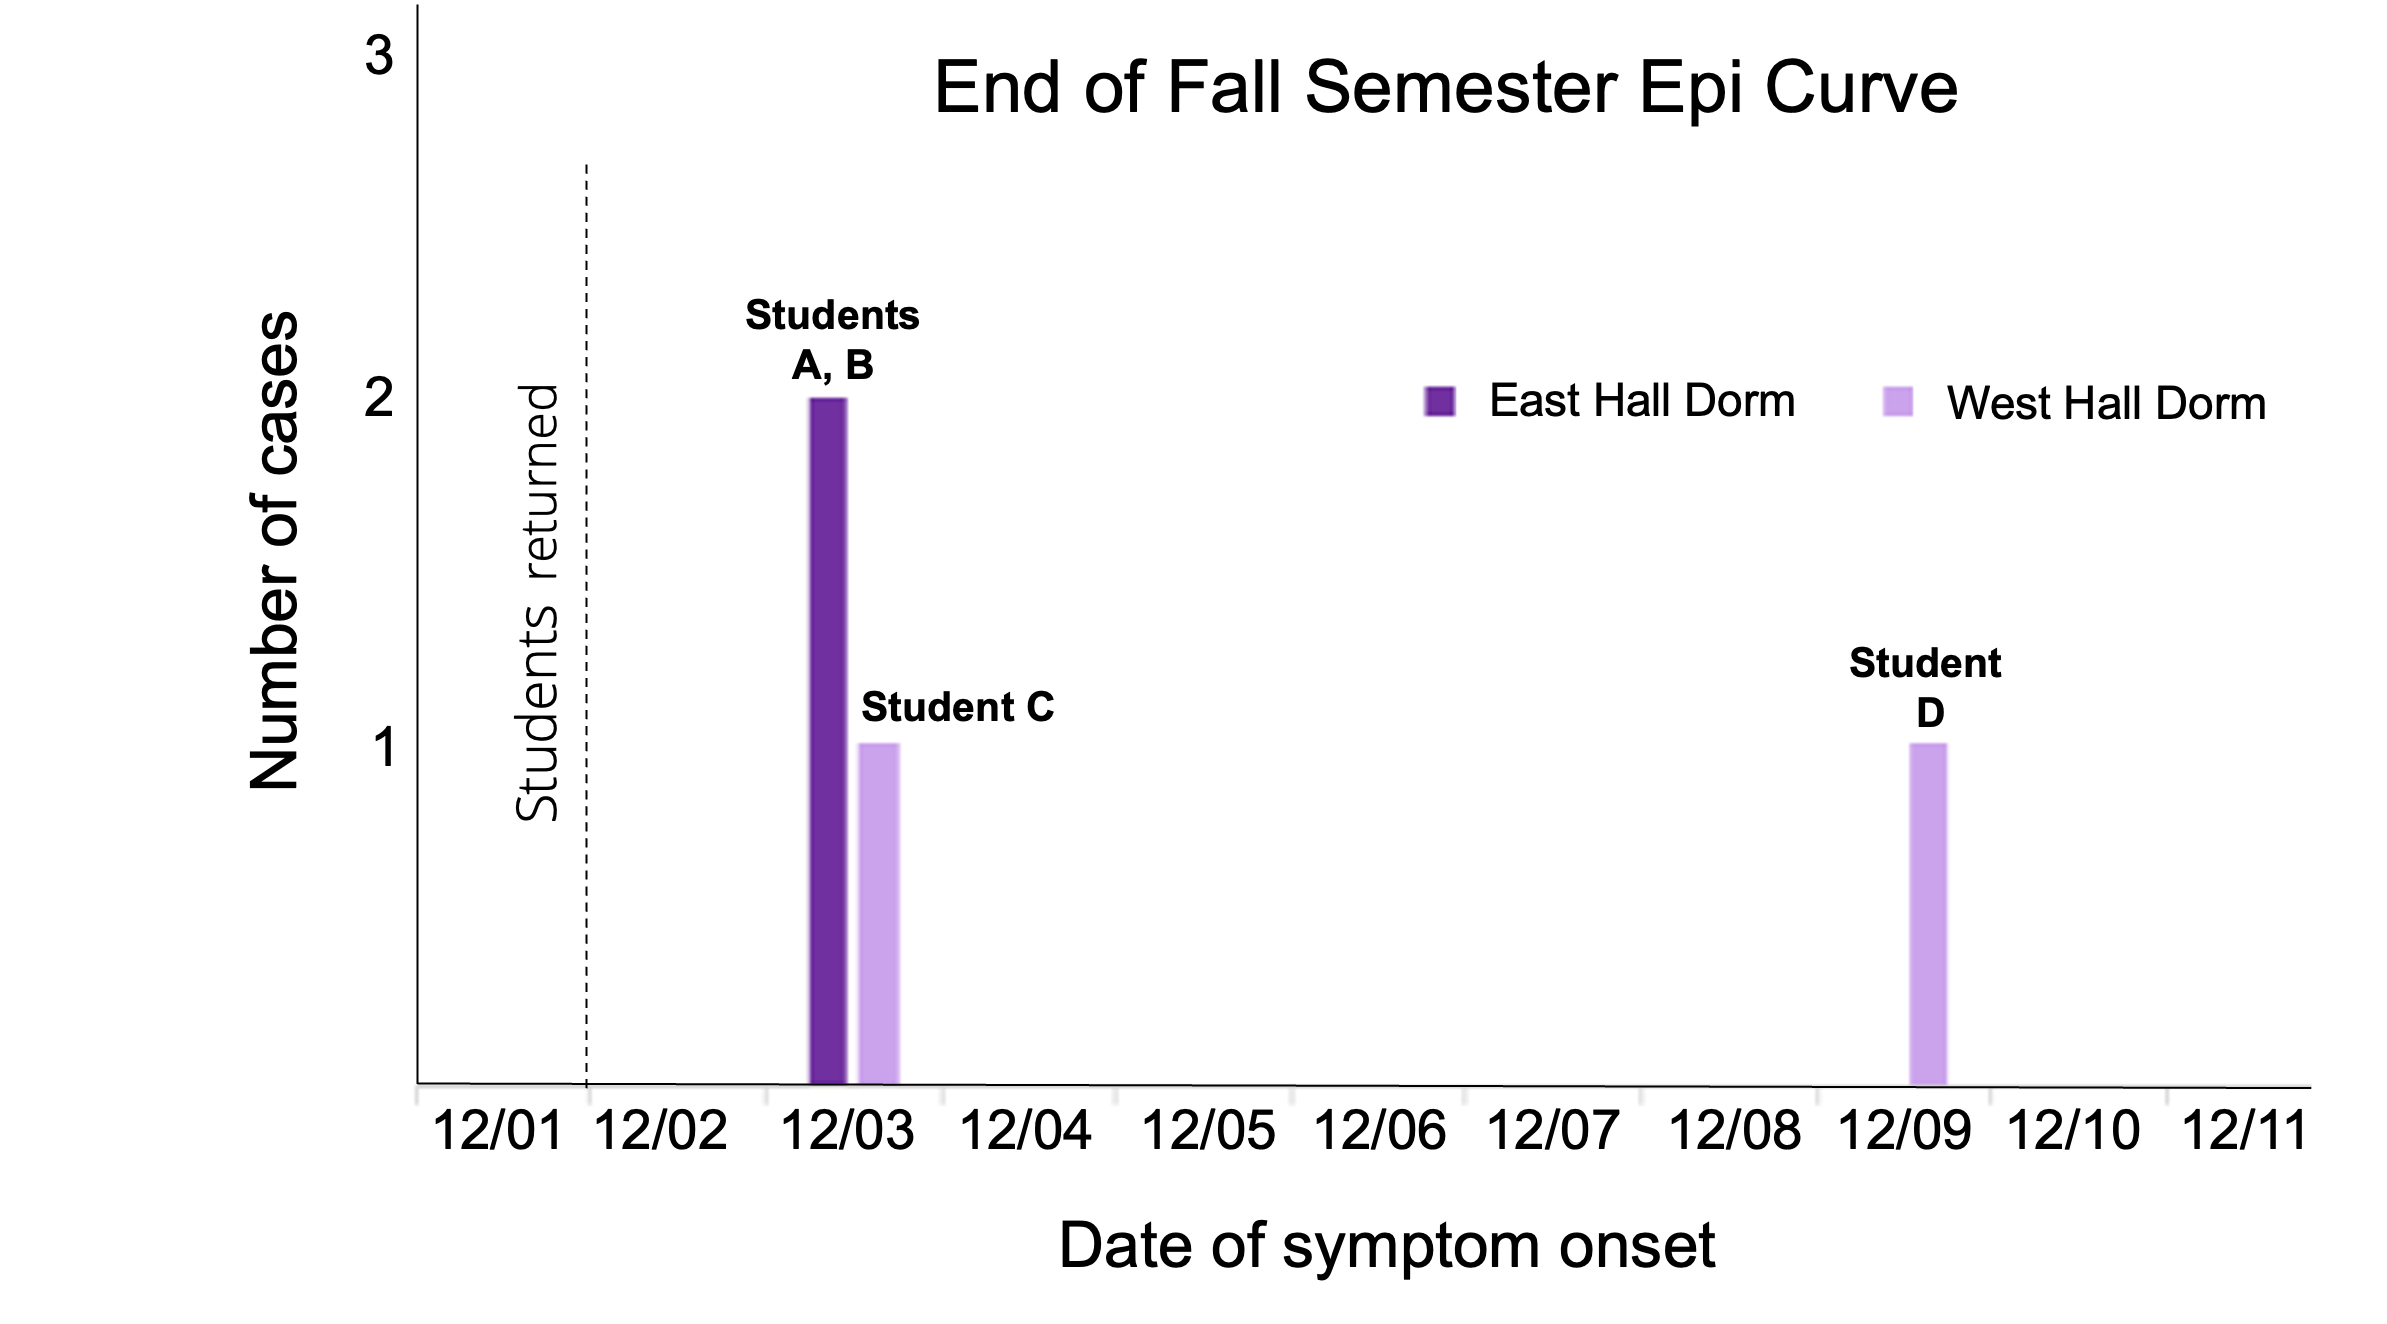
After students return from a 1-week break at the end of the fall semester, you observe an uptick in COVID-19 cases reported from Smarty-Pants University. However, it is unclear if these cases are related to one another.
![]()
There are four students that have reported COVID-19 symptoms and were tested for SARS-CoV-2 shortly after their time of symptom onset. The students do not report a known close-contact to a confirmed COVID-19 case or recent travel history outside the County.
![]()
You need to know as soon as possible if the reported cases to date are part of an outbreak. You decide to create a targeted phylogenetic tree to help identify or rule out epi-linkages between students and evaluate if there is transmission happening on campus. The targeted tree will allow you to identify and examine samples most closely related to the student samples.
![]()
You notice that the student samples are indeed closely related and are all part of Pango lineage B.1.311. When you zoom in on the lineage, you notice a few things.
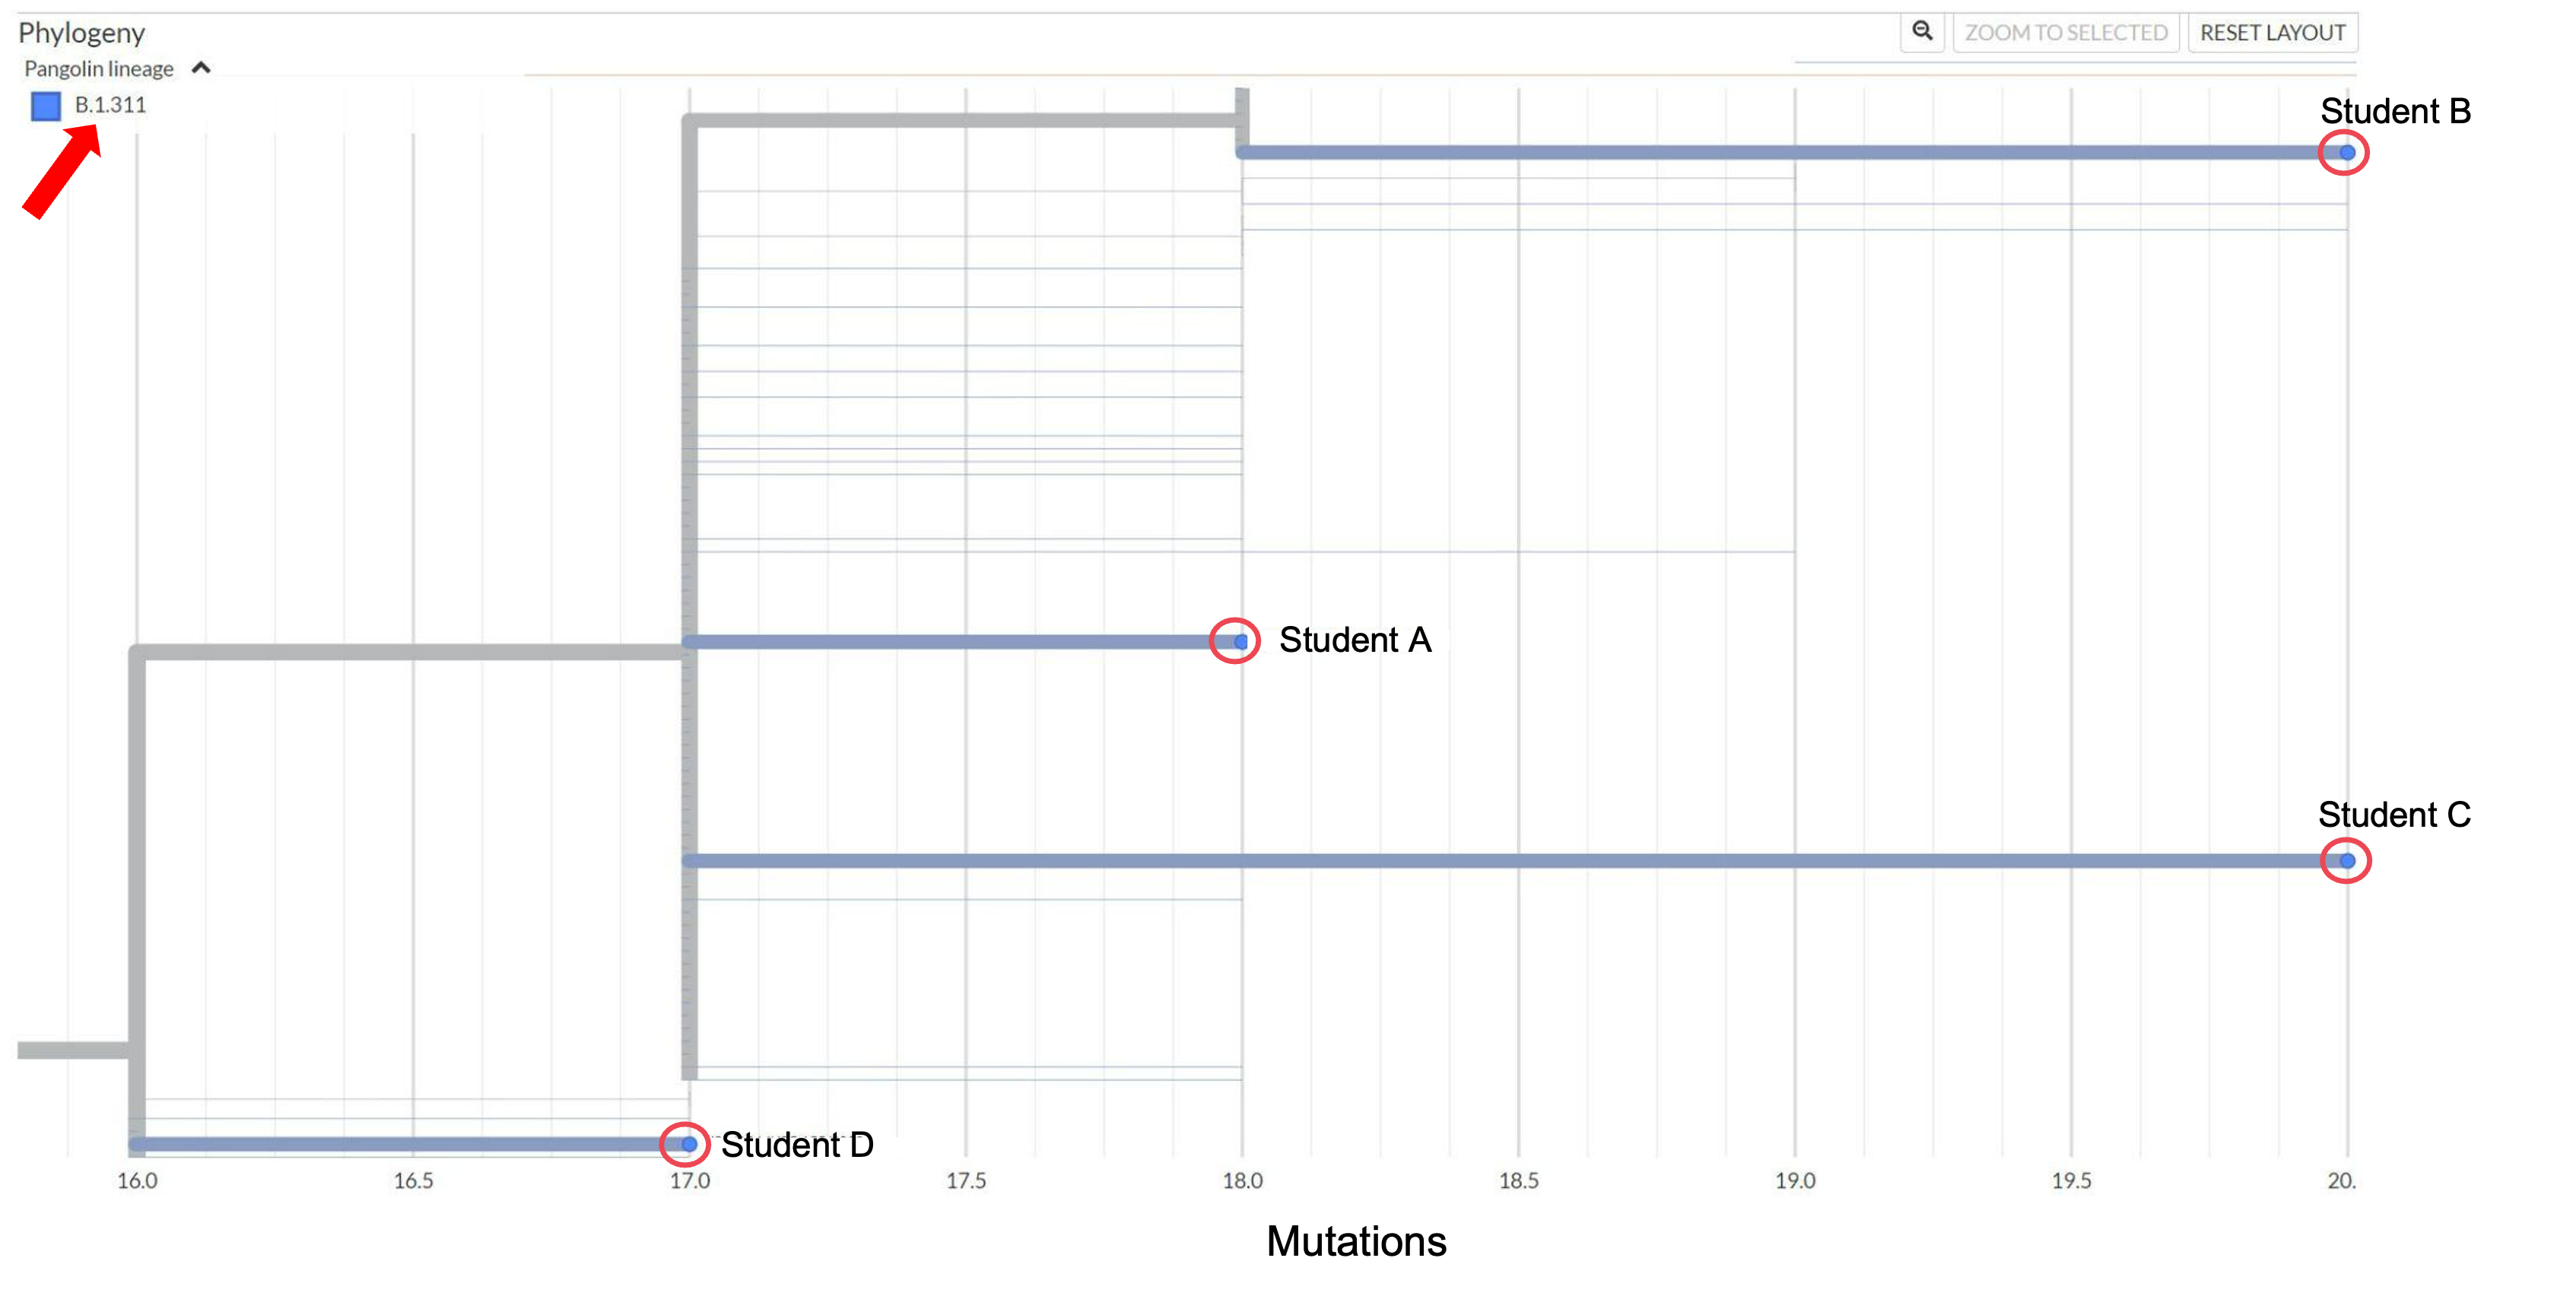
Targeted tree after zooming on Pango lineage B.1.311. The four student samples (blue branches) are highlighted with red circles.
Things to notice from the targeted tree:
- Student D seems highly distinct from Students A, B, and C, given that it is on a separate clade.
- Students A, B, and C are in their own clade defined by an additional mutation (T2984C). This clade started with many identical samples.
Targeted tree highlighting identical samples within clade defined by mutation T2984C.
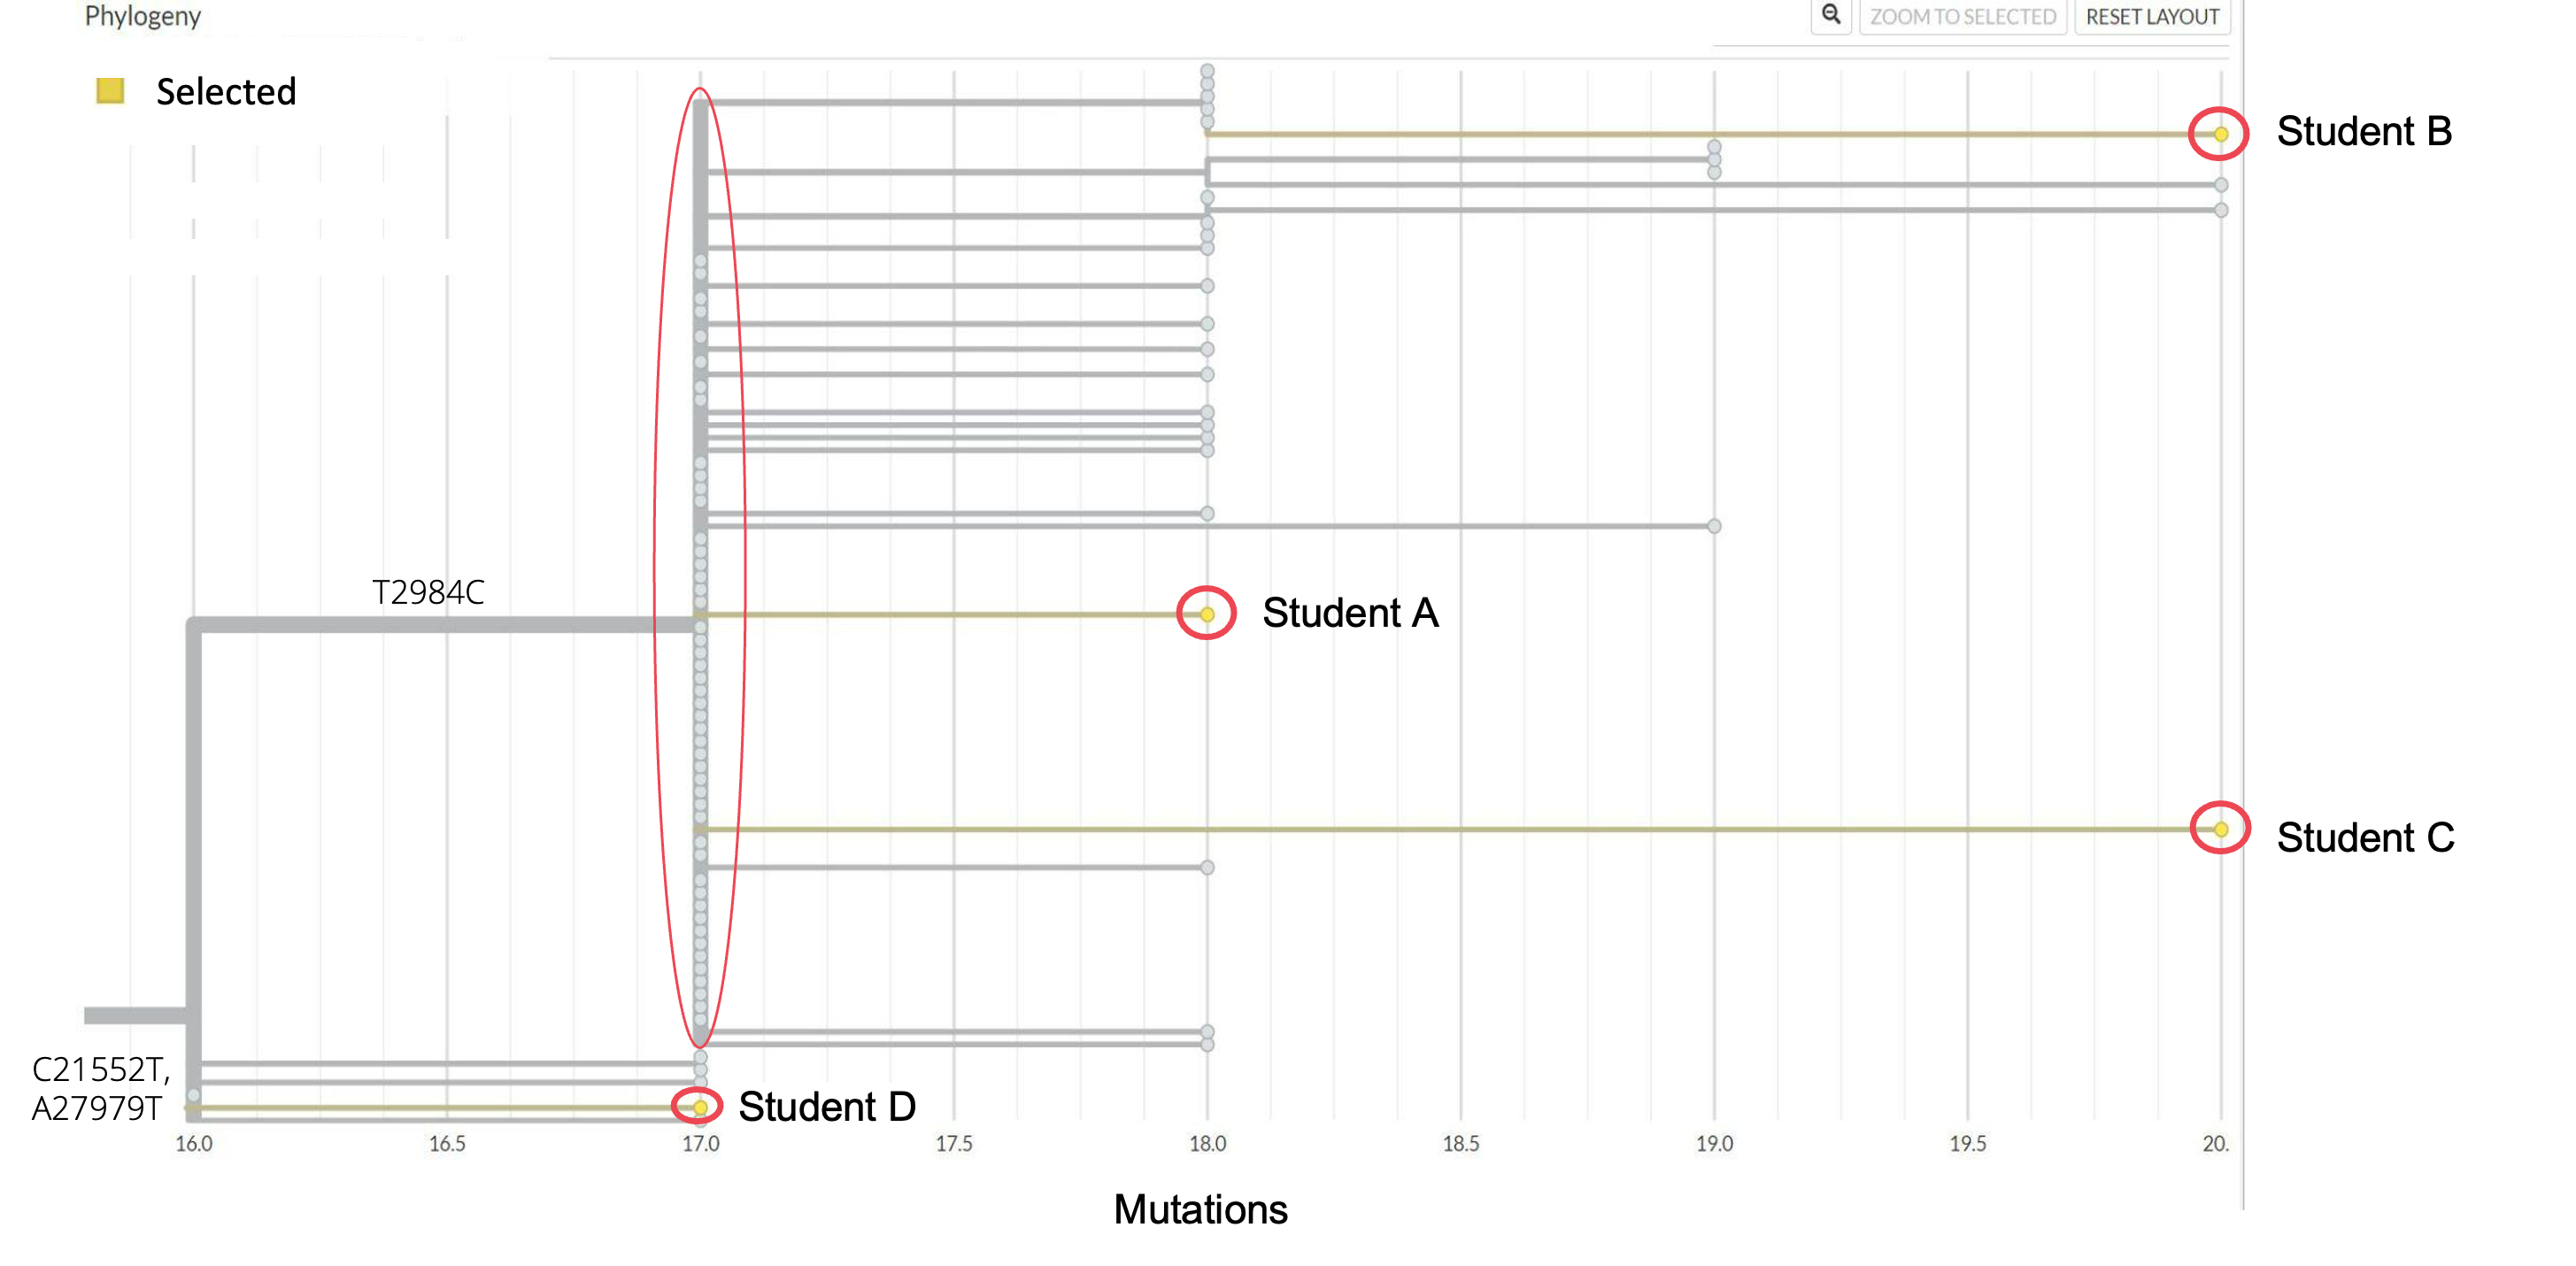
- Students A-C acquired 1-3 additional unique mutations relative to mutation T2984C. Students B and C are the most divergent (gained 3 mutations relative to mutation T2984C and 6 mutations relative to each other).
- The phylogenetic tree does not yet show evidence of forward transmission or direct transmission chains between Students A-D.
![]()
It seems unlikely that Student D is related to Students A, B, and C. Additionally, given the amount of genetic divergence between Students A-C, it seems unlikely that they are directly epi-linked to each other or a shared close contact despite similar onset of illness. However, it is interesting that Students A, B, and C are part of the same clade and stem from many identical sequences. There are two possible explanations:
- Option 1: Students A-C acquired these infections separately in the community and similarities between sequences are a coincidence.
- Option 2: These students are part of a larger outbreak that started in the community and then seeded transmission within the university. This could be possible if several chains of transmission went undetected at the university due to asymptomatic infection and a lack of testing or sequencing of positive samples.
You decide to look at the tree again using a time scale instead of a divergence scale (mutations) to see if you can eliminate one of the possible scenarios.
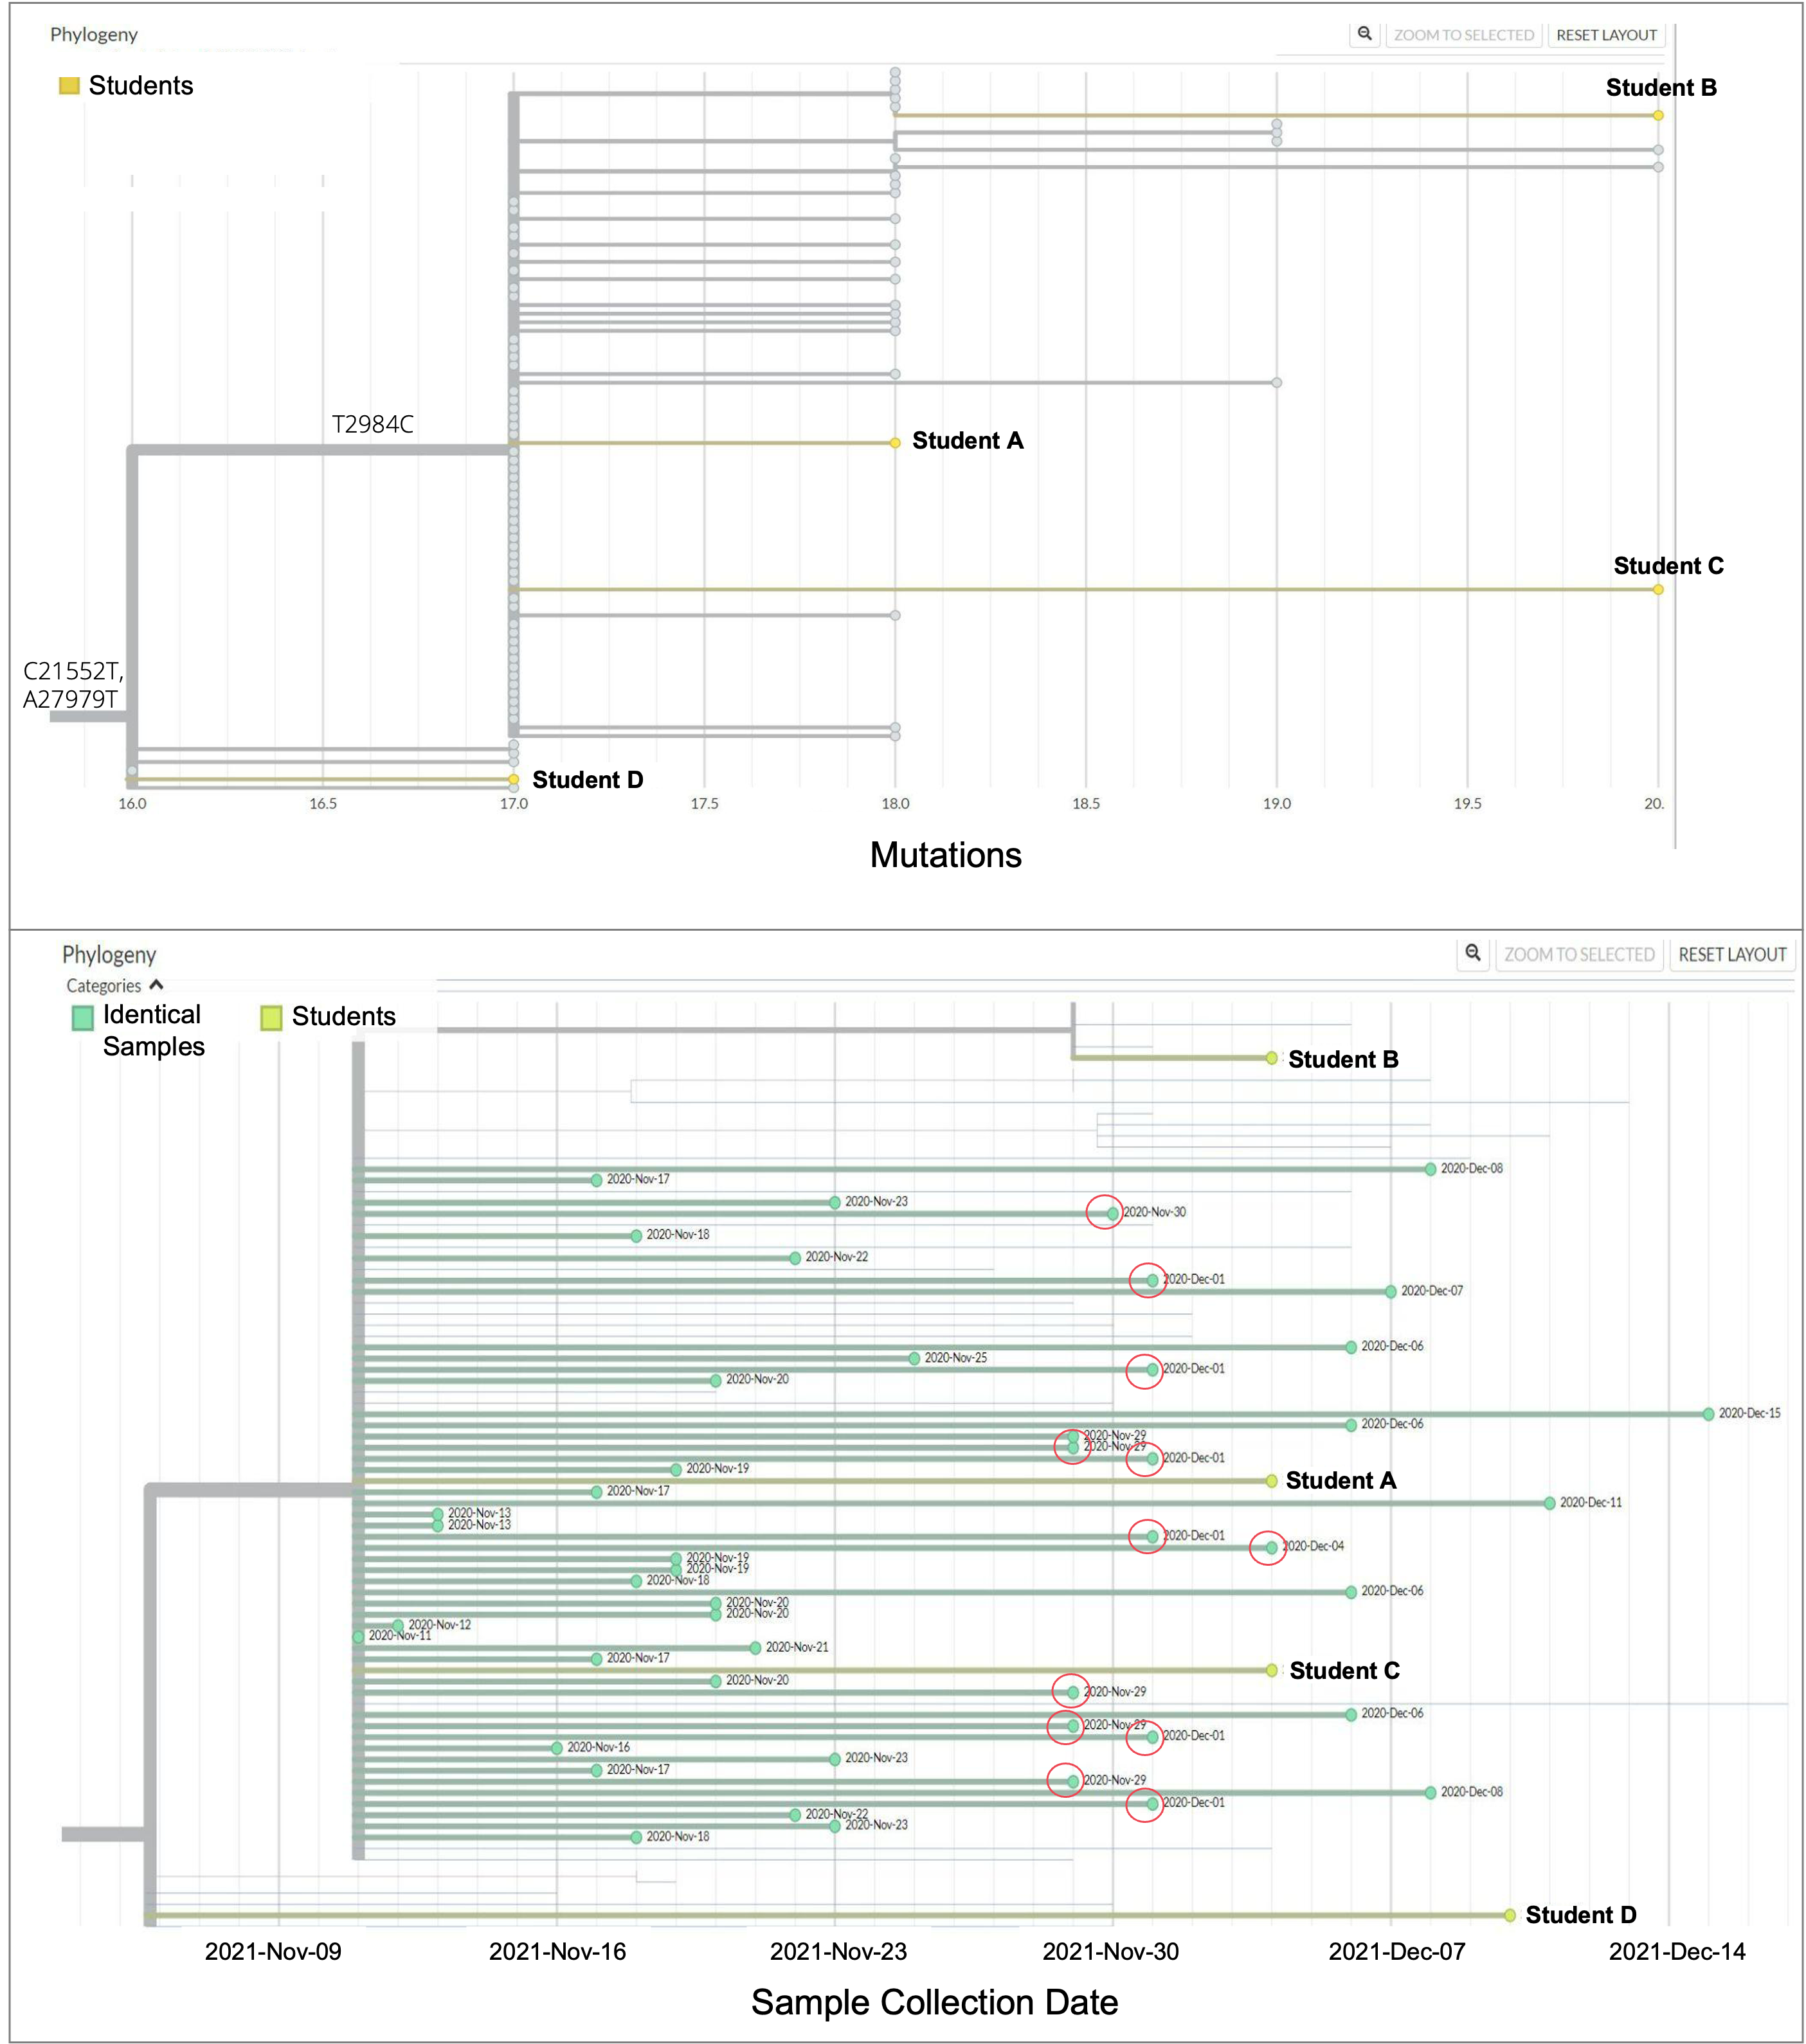
Targeted trees scaled by number of mutations (top panel) and time of collection (bottom panel). Yellow branches in both panels are highlighting student samples. Green branches in the bottom panel represent samples that have identical sequences and are closest to the most recent common ancestor that led to the clade defined by mutation T2984C. These identical samples are further distinguished with red circles if they were collected within a week of student sample collections.
Things to notice from the tree showing a time scale:
- Many of the identical samples highlighted in green (part of clade with T2984C mutation) were collected weeks prior to student sample collection.
- However, there are several identical samples (green branch tips highlighted with red circles) that were collected within a week of student sample collections. When you look them up in your disease surveillance database you realize these were not collected from students and, thus appear to be samples from the community instead.
You cannot rule out any of the two possible explanations given that there were many identical samples from the community directly preceding those identified at the university. You decide to inquire about the Smarty-Pants University’s sampling scheme. Is routine testing performed on campus? Were all the cases from this University reported and sequenced? Or, are there more potential samples not depicted on this tree? Understanding the sampling framework may change your understanding and interpretation of case linkages.
- Additional sampling information: All students who are symptomatic, have known close contacts to a COVID case, or have recently traveled outside of the County are asked to test for COVID through the student health center for later sequencing. However, it is not a mandatory requirement and there is no routine surveillance testing.
- Issue: It’s possible there could be additional, undetected positive samples, especially from asymptomatic cases or those who spend time off-campus in the community. The sampling scheme doesn’t appear to be representative and could skew our interpretation.
![]()

Targeted tree after zooming on Pango lineage B.1.311. The four student samples (blue branches) are highlighted with red circles.
Things to notice from the targeted tree:
- Student D seems highly distinct from Students A, B, and C, given that it is on a separate clade.
- Students A, B, and C are in their own clade defined by an additional mutation (T2984C). This clade started with many identical samples.
Targeted tree highlighting identical samples within clade defined by mutation T2984C.

- Students A-C acquired 1-3 additional unique mutations relative to mutation T2984C. Students B and C are the most divergent (gained 3 mutations relative to mutation T2984C and 6 mutations relative to each other).
- The phylogenetic tree does not yet show evidence of forward transmission or direct transmission chains between Students A-D.
![]()
Despite living in similar dorm buildings with similar symptom onset dates and the same SARS-CoV-2 Pangolin lineage, Students A-D do not appear to be directly linked to each other. However, additional information is needed to definitively say whether or not an outbreak is brewing on campus. What led to this conclusion? What limitations would you put around it?
- You know that at least one student sample (Student D) is not linked to the other three cases (Students A-C), as it is found in its own, separate clade on the targeted tree.
- Given that Students A-C became symptomatic within one week of each other and their samples are separated by 2 or more mutations, it is unlikely that Students A-C are directly linked through a shared exposure or close contact.
- Given the many identical sequences preceding samples A-C in the clade defined by the T2984C mutation and the long branch lengths seen for samples from Students B and C, it is possible that the university is missing multiple chains of transmission among asymptomatic individuals. Infections on campus could have been seeded from a broader community outbreak or other infections on campus that were undetected.
- You recommend to Smarty-Pants University to continue standard infection control practices on campus to prevent further transmission from these four cases. In addition, they might want to consider changing their testing and sequencing policies to rule out this scenario in the future. For example, they could add routine surveillance testing for all students, faculty, and staff on campus when community levels of transmission are high.
Challenging scenario
As college students are returning from their 2021-2022 winter break, you observe an uptick in COVID-19 cases reported from Smarty-Pants University. However, it is unclear if these cases are related to one another.
![]()
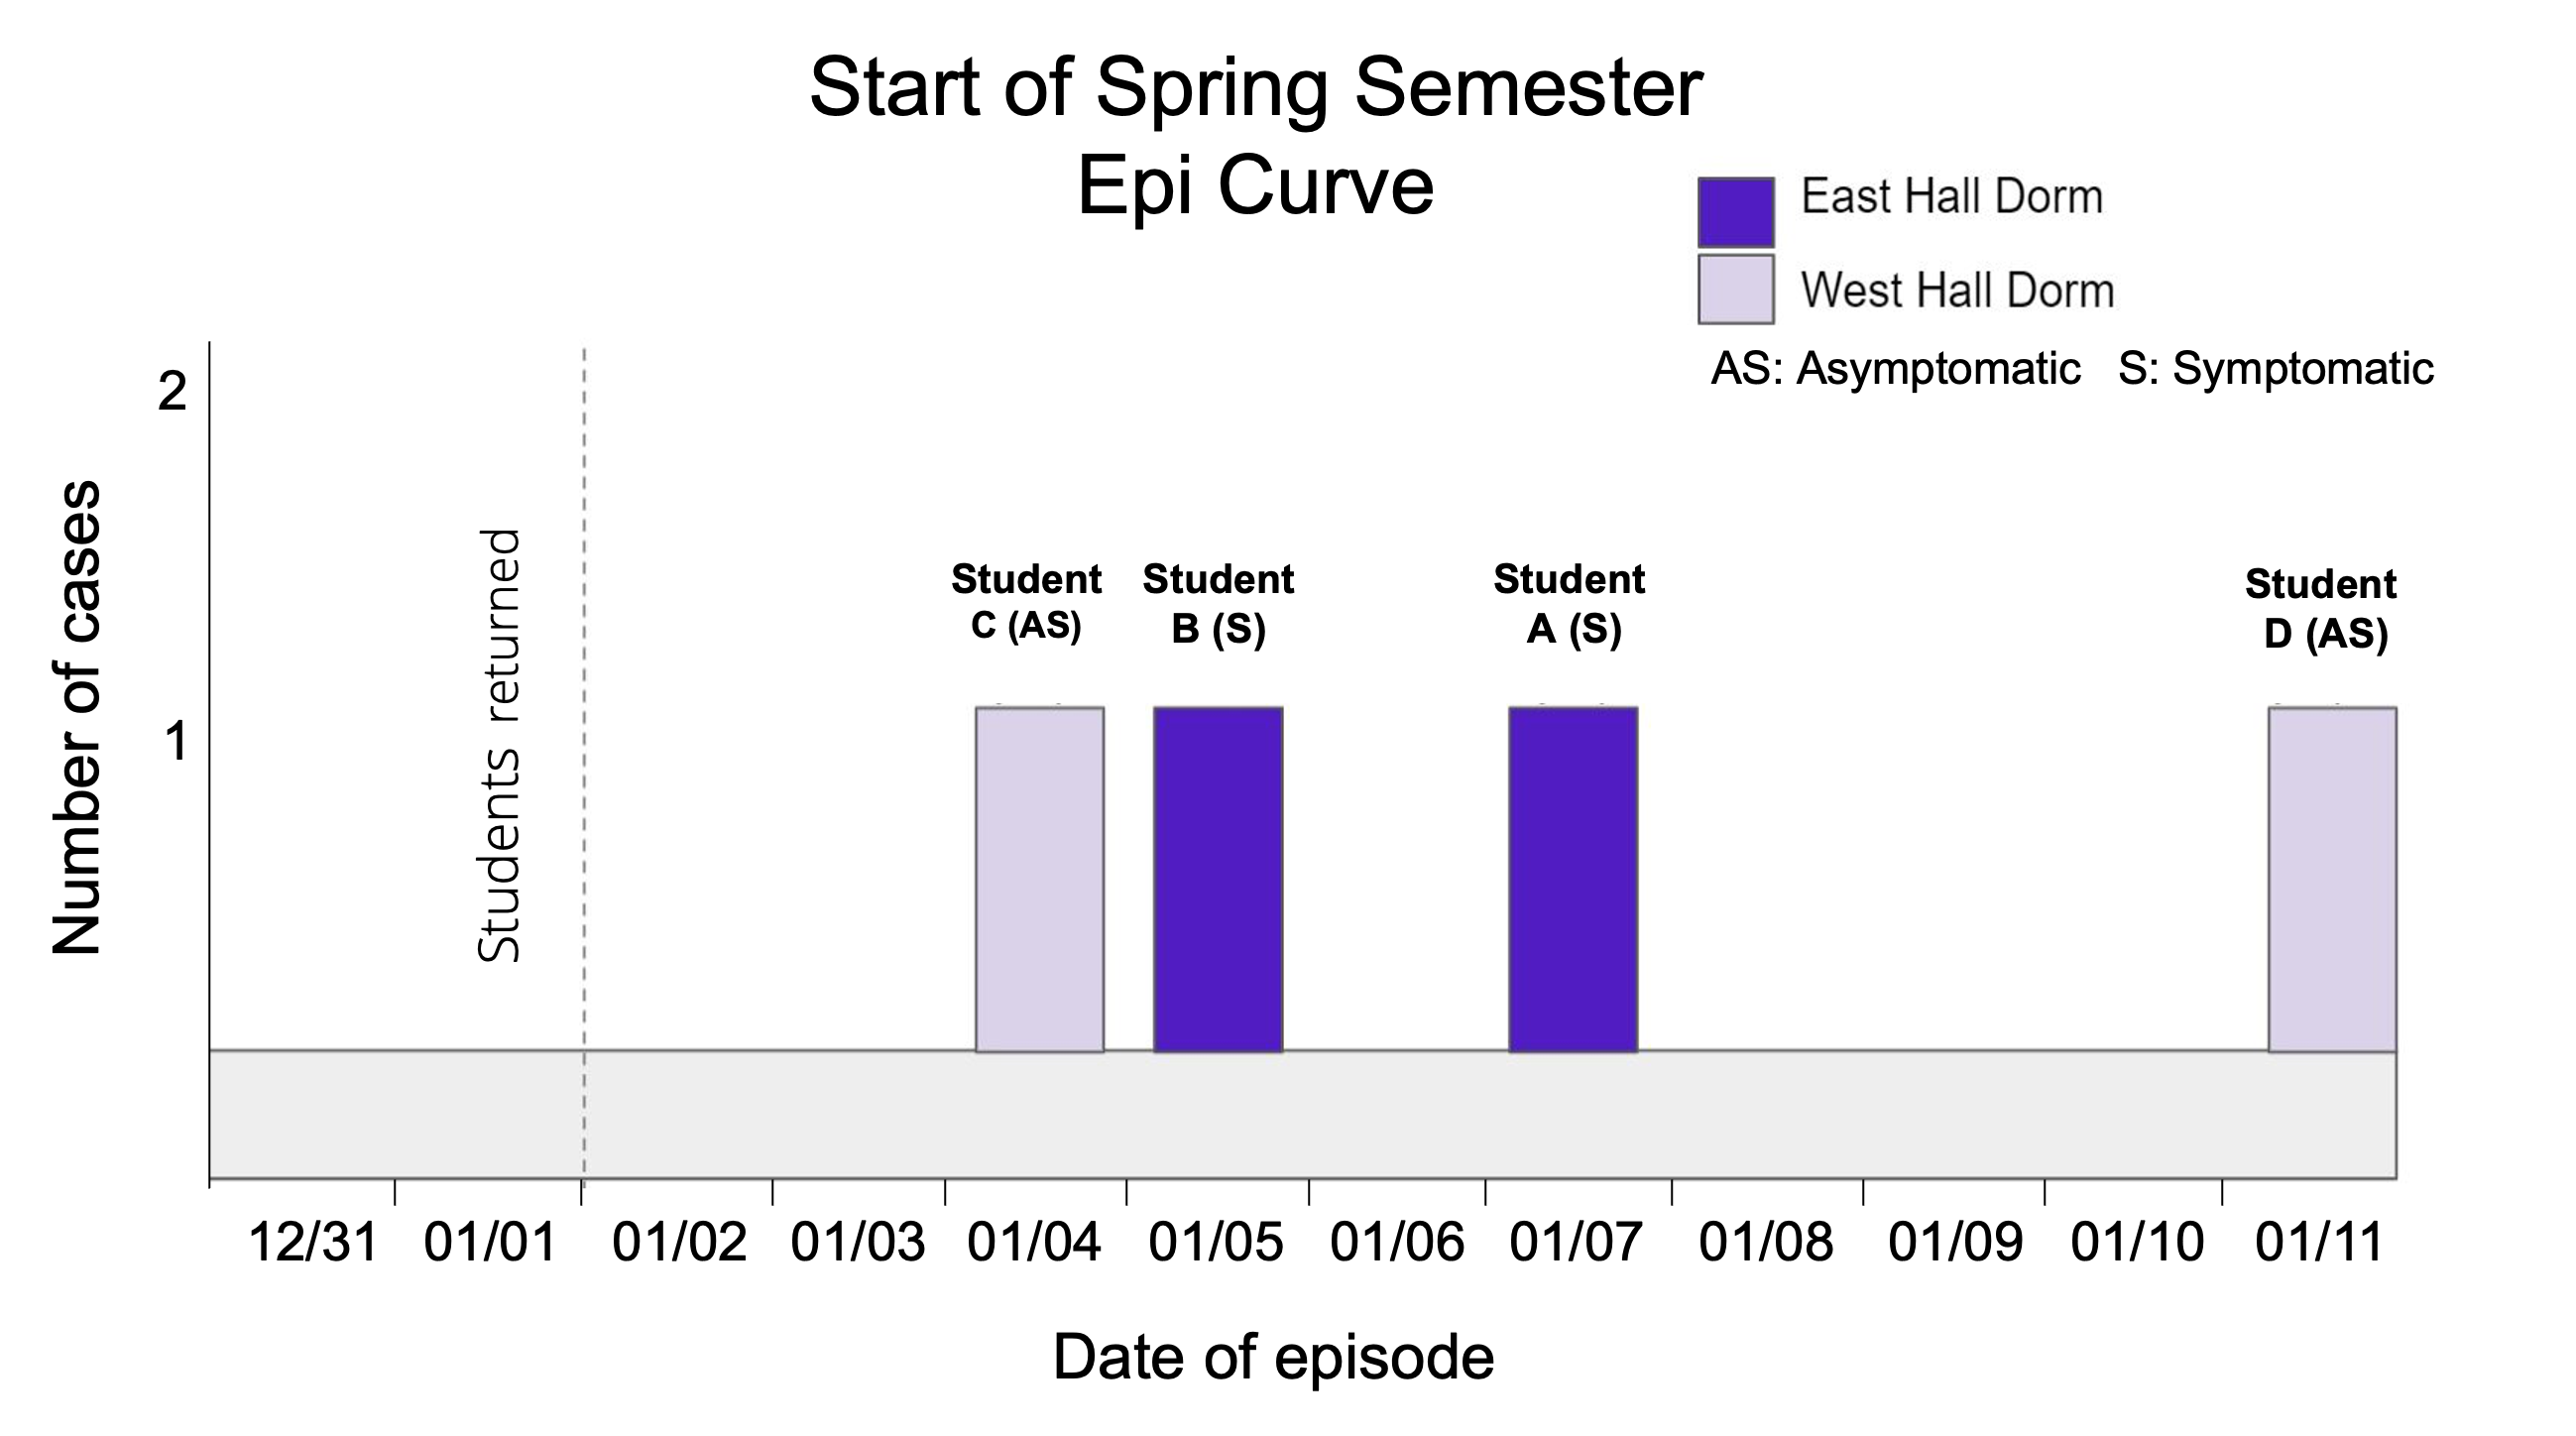
There are four students that have reported COVID-19 symptoms and tested positive for SARS-CoV-2. Below are the earliest dates of known infection (episode) based on symptom development or positive test.
![]()
You need to know as soon as possible if the reported cases to date are part of an outbreak. You decide to create a targeted phylogenetic tree to help identify or rule out epi-linkages between students and evaluate if there is transmission happening on campus. The targeted tree will allow you to identify and examine samples most closely related to the student samples.
![]()
You noticed that samples from two students (Students A and B) seem to be identical, but the other two are different.
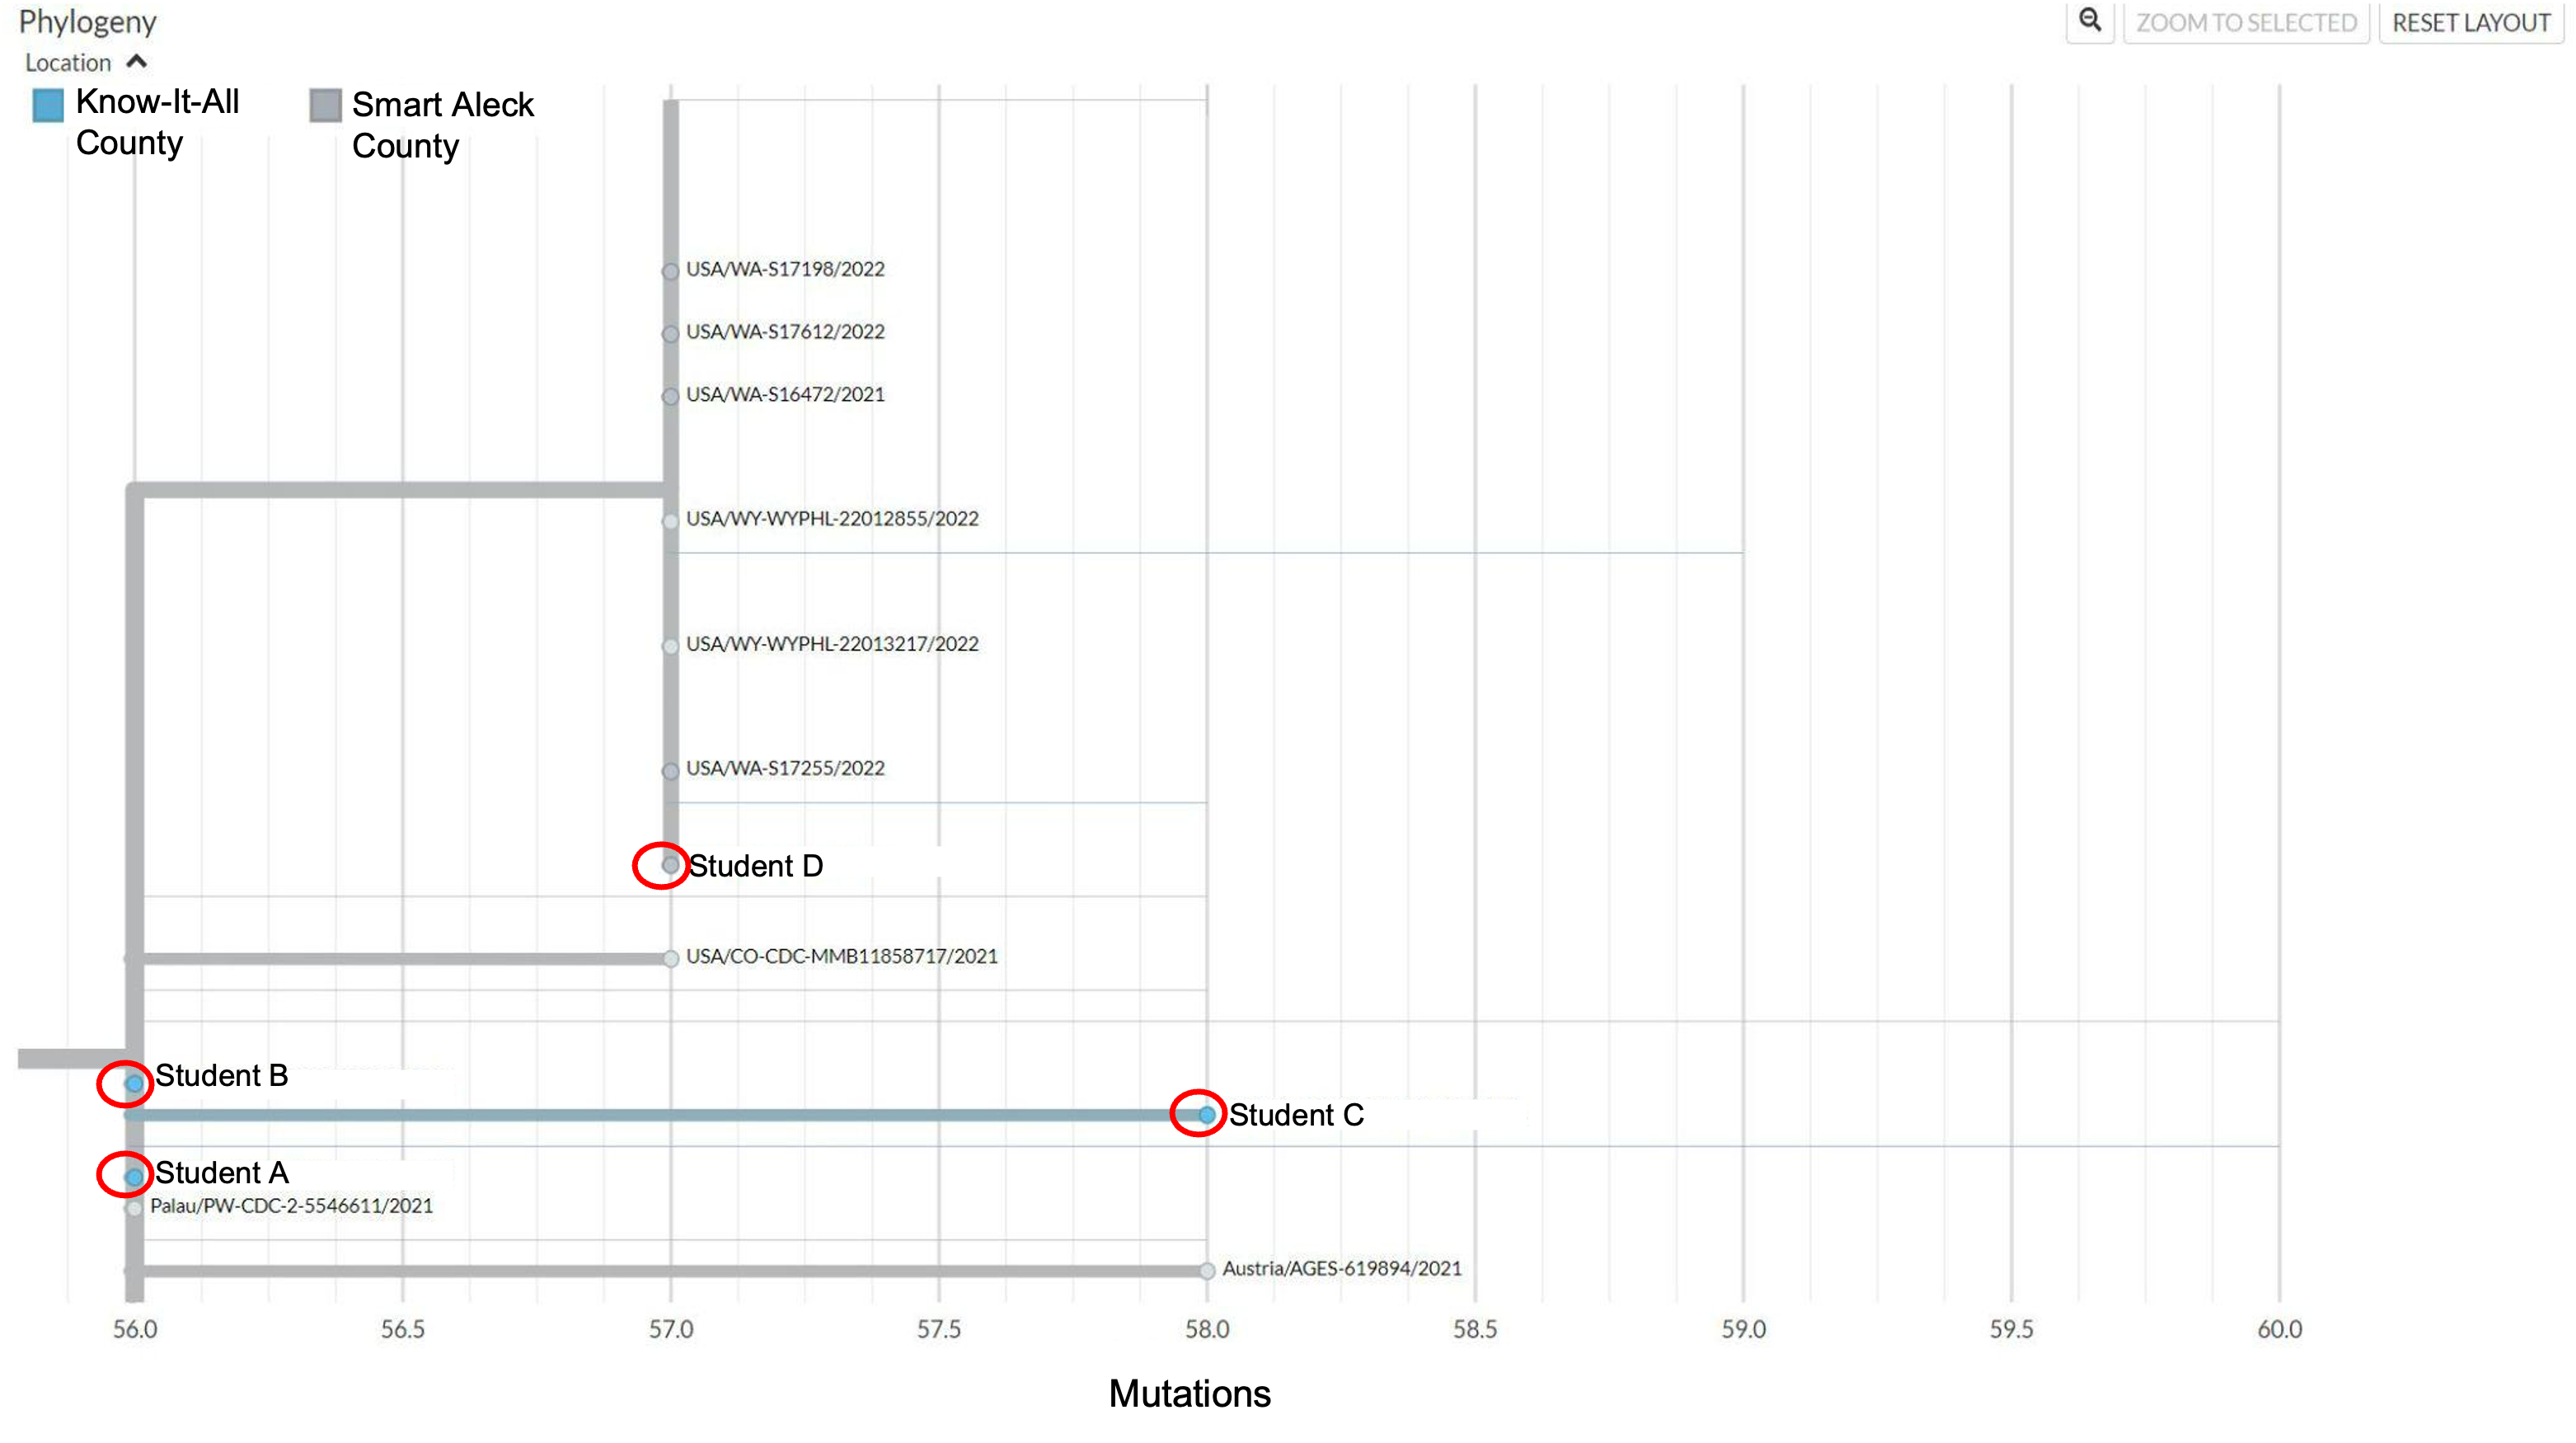
Targeted tree showing samples from the four students (highlighted with red circles) and closely related samples.
Things to notice about the targeted tree:
- Students A and B have identical sequences and have diverged by 56 mutations from the root of the tree.
- Student C has 2 additional mutations compared to Students A and B, despite an earlier sample collection date.
- Student D is on a separate clade and diverged from Students A and B by 1 mutation. You notice that Student D sequences are identical to several samples from Washington and Wyoming.
- Student C and D are separated by 3 mutations.
The phylogenetic data gave you good clues. Based on the targeted tree, you conclude the following:
- Students A and B are likely epi-linked. Given the case episode date provided by surveillance data, it’s possible Student B infected Student A. However, it’s also possible they share a separate common exposure from another person not tested or sequenced. Directionality is typically difficult to ascertain from genomic data alone, but it seems likely the two are epidemiologically linked.
- The sample from Student C has 2 additional mutations on top of the genetic background seen in Students A and B samples. This suggests Student C is possibly part of the same transmission chain but likely not directly linked to Students A and B. It is unclear if/how the three students are linked. Genomic data alone is not conclusive here.
- There is a possibility that Student D is also related to Students A and B. The sample from Student D was most closely related to samples from Washington, where the student traveled for winter break. However, when someone has a travel history and acquires an infection outside your jurisdiction, the sequence is usually more notably diverged (see Straightforward scenario as an example). Unfortunately, neither option can be ruled out here.
![]()
You decide to find out more about the sampling scheme and where students traveled during their winter break. You want to answer the following questions based on the information you gathered so far:
- Student C tested positive first. However, the sequences from Students A and B are more ancestral (or basal) relative to the sample from Student C suggesting that these students were infected first. How is this possible?
- Answer/Discussion: Trees are not transmission diagrams and there are a few ways this could occur. It’s possible that Student C became infected by Students A or B. However, this is unlikely because Student C had acquired 2 mutations relative to Students A and B in the span of 1 week rather than 1 month (which is the average time to acquire 2 mutations). Note that the sample collection date is not always informative because when or how someone decides to get a test can be influenced by a variety of factors (examples: when they discover they were exposed, symptom onset, accessibility of test, etc). However, it’s also possible that all three students share a common exposure to a case that wasn’t sequenced and isn’t on the tree. Alternatively, Student C could have acquired a similar strain separately in the community and is not directly epi-linked to Students A or B. See Transmission tree is not the same as a phylogenetic tree for more information about this topic.
- Where did each student travel during their winter break prior to returning to school?
- Answer: Student D went home to Smart Aleck County in Washington. It is possible that this student acquired the infection while traveling since the most closely related samples are from Washington. Students A and B went home to Virginia and Student C stayed local. Unfortunately, travel history isn’t a clear indicator of where infection likely took place in this particular tree.
- What was the sequencing and sampling scheme? Were all the cases from Smarty-Pants University sequenced or are there more cases not depicted on your targeted tree?
- Answer: Smarty-Pants University policy is to sequence all positive samples in their lab. However, it is not mandatory for students to test prior to returning to campus from break and there could be other undetected cases on campus.
- Do Students A, B and C share any common exposures or location histories?
- Answer: Students A and B live in the same dorm building and are both from Virginia, but you found out from the case investigators that these students do not share any known exposures with Student C.
- What was the data quality for the sequences?
-
- Answer: To learn about sequence data quality, you can view some QC metrics within Nextstrain and/or you can place your samples on a pre-calculated SARS-CoV-2 tree using UShER.
- To view QC metrics on Nextstrain, you color the tree by missing data and explore other QC metrics of interest, including: mixed sites, reversion mutations, and potential contaminants. For more details about how to view trees in Nextstrain and enable coloring click here.
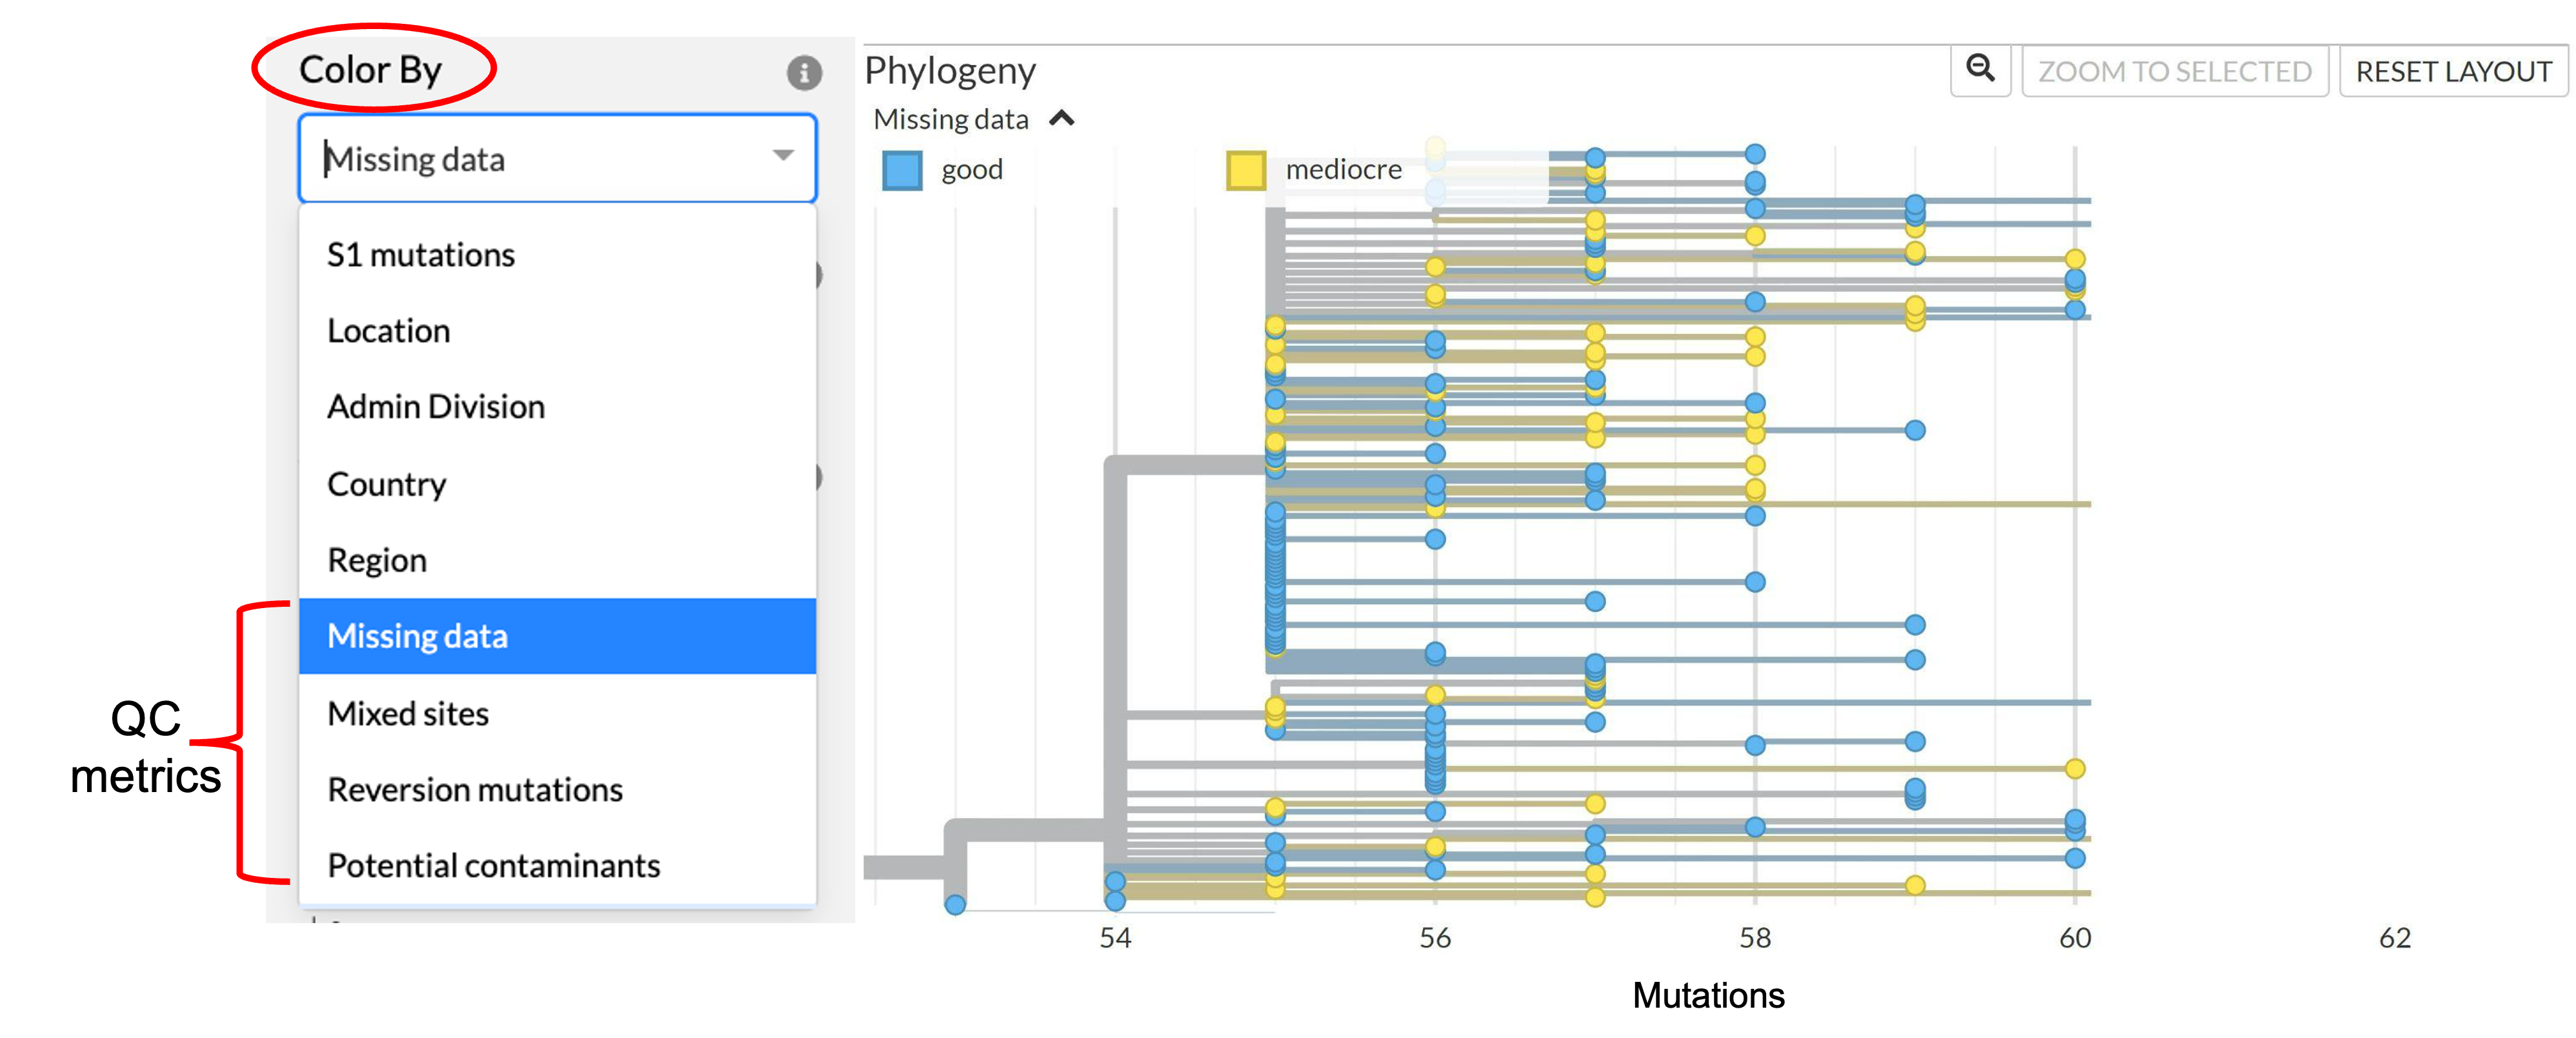
Targeted tree colored by missing data (refers to the number of unknown bases or Ns). The tree can also be colored by other QC metrics found under the ‘Color By’ dropdown menu on the left-hand side of the Nextstrain tree page.
-
- You then decide to use UShER to see more detailed QC data. After running a phylogenetic placement for the four student samples you obtained the following results:

- Based on these UShER results, you notice the following:
- The sequence obtained from Student C has a high number (1599) of undetermined bases (Ns). It is possible that this missing data led to a misplacement on the targeted tree.
- The sequence obtained from Student A has a moderate number (295) of undetermined bases (Ns) and there is low confidence in its placement on the tree (42 potentially good placements).
- Samples were placed on separate subtrees. Unlike Nextstrain, UShER is suggesting that they are not closely related. However, this could be due to a user set threshold that limits the number of sequences on a given subtree. If the number of closely related samples exceeds the threshold, they may be placed on different subtrees.
There are four students that have reported COVID-19 symptoms and tested positive for SARS-CoV-2. Below are the earliest dates of known infection (episode) based on symptom development or positive test.

![]()
You need to know as soon as possible if the reported cases to date are part of an outbreak. You decide to create a targeted phylogenetic tree to help identify or rule out epi-linkages between students and evaluate if there is transmission happening on campus. The targeted tree will allow you to identify and examine samples most closely related to the student samples.
![]()
You noticed that samples from two students (Students A and B) seem to be identical, but the other two are different.

Targeted tree showing samples from the four students (highlighted with red circles) and closely related samples.
Things to notice about the targeted tree:
- Students A and B have identical sequences and have diverged by 56 mutations from the root of the tree.
- Student C has 2 additional mutations compared to Students A and B, despite an earlier sample collection date.
- Student D is on a separate clade and diverged from Students A and B by 1 mutation. You notice that Student D sequences are identical to several samples from Washington and Wyoming.
- Student C and D are separated by 3 mutations.
The phylogenetic data gave you good clues. Based on the targeted tree, you conclude the following:
- Students A and B are likely epi-linked. Given the case episode date provided by surveillance data, it’s possible Student B infected Student A. However, it’s also possible they share a separate common exposure from another person not tested or sequenced. Directionality is typically difficult to ascertain from genomic data alone, but it seems likely the two are epidemiologically linked.
- The sample from Student C has 2 additional mutations on top of the genetic background seen in Students A and B samples. This suggests Student C is possibly part of the same transmission chain but likely not directly linked to Students A and B. It is unclear if/how the three students are linked. Genomic data alone is not conclusive here.
- There is a possibility that Student D is also related to Students A and B. The sample from Student D was most closely related to samples from Washington, where the student traveled for winter break. However, when someone has a travel history and acquires an infection outside your jurisdiction, the sequence is usually more notably diverged (see Straightforward scenario as an example). Unfortunately, neither option can be ruled out here.
![]()
You decide to find out more about the sampling scheme and where students traveled during their winter break. You want to answer the following questions based on the information you gathered so far:
- Student C tested positive first. However, the sequences from Students A and B are more ancestral (or basal) relative to the sample from Student C suggesting that these students were infected first. How is this possible?
- Answer/Discussion: Trees are not transmission diagrams and there are a few ways this could occur. It’s possible that Student C became infected by Students A or B. However, this is unlikely because Student C had acquired 2 mutations relative to Students A and B in the span of 1 week rather than 1 month (which is the average time to acquire 2 mutations). Note that the sample collection date is not always informative because when or how someone decides to get a test can be influenced by a variety of factors (examples: when they discover they were exposed, symptom onset, accessibility of test, etc). However, it’s also possible that all three students share a common exposure to a case that wasn’t sequenced and isn’t on the tree. Alternatively, Student C could have acquired a similar strain separately in the community and is not directly epi-linked to Students A or B. See Transmission tree is not the same as a phylogenetic tree for more information about this topic.
- Where did each student travel during their winter break prior to returning to school?
- Answer: Student D went home to Smart Aleck County in Washington. It is possible that this student acquired the infection while traveling since the most closely related samples are from Washington. Students A and B went home to Virginia and Student C stayed local. Unfortunately, travel history isn’t a clear indicator of where infection likely took place in this particular tree.
- What was the sequencing and sampling scheme? Were all the cases from Smarty-Pants University sequenced or are there more cases not depicted on your targeted tree?
- Answer: Smarty-Pants University policy is to sequence all positive samples in their lab. However, it is not mandatory for students to test prior to returning to campus from break and there could be other undetected cases on campus.
- Do Students A, B and C share any common exposures or location histories?
- Answer: Students A and B live in the same dorm building and are both from Virginia, but you found out from the case investigators that these students do not share any known exposures with Student C.
- What was the data quality for the sequences?
-
- Answer: To learn about sequence data quality, you can view some QC metrics within Nextstrain and/or you can place your samples on a pre-calculated SARS-CoV-2 tree using UShER.
- To view QC metrics on Nextstrain, you color the tree by missing data and explore other QC metrics of interest, including: mixed sites, reversion mutations, and potential contaminants. For more details about how to view trees in Nextstrain and enable coloring click here.

Targeted tree colored by missing data (refers to the number of unknown bases or Ns). The tree can also be colored by other QC metrics found under the ‘Color By’ dropdown menu on the left-hand side of the Nextstrain tree page.
-
- You then decide to use UShER to see more detailed QC data. After running a phylogenetic placement for the four student samples you obtained the following results:

- Based on these UShER results, you notice the following:
- The sequence obtained from Student C has a high number (1599) of undetermined bases (Ns). It is possible that this missing data led to a misplacement on the targeted tree.
- The sequence obtained from Student A has a moderate number (295) of undetermined bases (Ns) and there is low confidence in its placement on the tree (42 potentially good placements).
- Samples were placed on separate subtrees. Unlike Nextstrain, UShER is suggesting that they are not closely related. However, this could be due to a user set threshold that limits the number of sequences on a given subtree. If the number of closely related samples exceeds the threshold, they may be placed on different subtrees.


