By the end of this video, you should be familiar with how we can take sequences, and information about when they were sampled, to infer a molecular clock that describes the evolutionary rate of a pathogen.
Take-home messages
- We refer to data associated with a sequence as metadata. The important piece of metadata that we need for estimating evolutionary rates is the sample collection date.
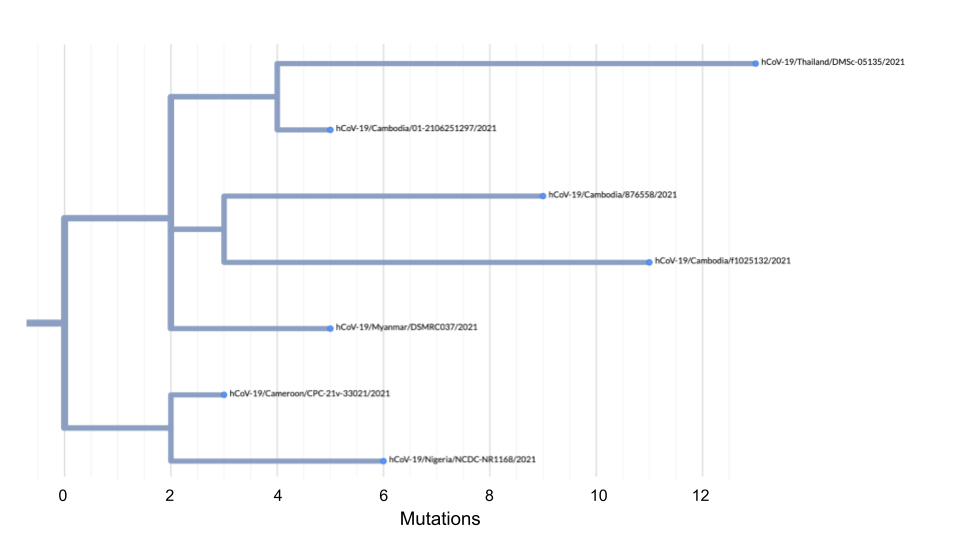
- You can calculate a root-to-tip distance for a sample by summing up the branch lengths between the root of the tree and a tip.
- The rate estimate comes from the slope of a regression line through a scatter plot of the root-to-tip distances plotted as a function of sampling date.
- The evolutionary rate represents the amount of genetic divergence we expect to accrue over a certain amount of time on average.
- Molecular clock, the evolutionary rate, or the substitution rate are all synonyms that describe this concept. These are different from the intrinsic mutation rate of a pathogen.
- Estimates of molecular clocks are improved by serial sampling, which means that genomic sequence data are collected consistently over time, rather than in large
Questions
- Using the tree below, calculate the root-to-tip distance of sample hCoV-19/Cameroon/CPC-21v-33021/2021.

- Now, pretend that hCoV-19/Cameroon/CPC-21v-33021/2021 was sampled on February 1, 2021. What would be the x and y coordinates of this sample if you were going to plot it on a root-top-tip plot?
- Below is a root-to-tip plot from a Nextstrain build of SARS-CoV-2 viruses. What does the regression line represent? When samples fall above the line, what does that mean? When samples fall below the line, what does that mean?


