By the end of this video, you should understand how to interpret an evolutionary rate. You should also be familiar with the different ways in which evolutionary rates might be written and how to interchange between them depending on your needs.
Take-home messages
- Evolutionary rates are commonly represented in two ways: normalized to the length of the genome sequence or not normalized to the length of the genome (substitutions per year).
- The normalized evolutionary rate describes the expected number of substitutions you would observe at a single nucleotide position (site) in the genome after a year of evolution. The non-normalized evolutionary rates are generally easier to interpret, which is why we often use them. They represent the number of substitutions we expect to see on average across the entire genome after a year of evolution. The units of this form of the rate are substitutions per year.
- If you want to compare rates between different pathogens you must use the rate that is normalized to the length of the genome. This is because even if two species of pathogens had the same evolutionary rate, the one with the longer genome will show a greater absolute number of substitutions.
- You can move between these two forms of the rate by dividing by the genome length (to go from non-normalized to normalized), or by multiplying by the genome length (to go from normalized to non-normalized).
- When thinking about what a rate of X substitutions per year means, imagine randomly sampling two sequences sampled exactly one year apart, and counting up how many nucleotide differences there are between the two sequences. Then imagine doing that many many times over. The evolutionary rate is akin to the average of the distances between sequences observed over all those trials.
- Evolutionary rates vary across different pathogens, although most RNA viruses will have an evolutionary rate somewhere on the order of 10^-4 or 10^-3 substitutions per site per year.
- Evolutionary rates describe the number of substitutions we observe at the consensus level over time. As discussed in Module 1, the rate at which we see substitutions depends on more than just the rate at which mutations occur; it also depends on factors such as the timescale over which you sample and the strength of selection. This means that rates are specific to your dataset and can vary between datasets even for the exact same species of pathogen.
Questions
- Imagine you have a virus with a 10,000 nucleotide long genome, and this virus has an average evolutionary rate of 8×10⁻⁴ substitutions per site per year. If you were to randomly sample two sequences separated by 3 months worth of transmission, on average how many mutations would you observe differentiating the sequences?
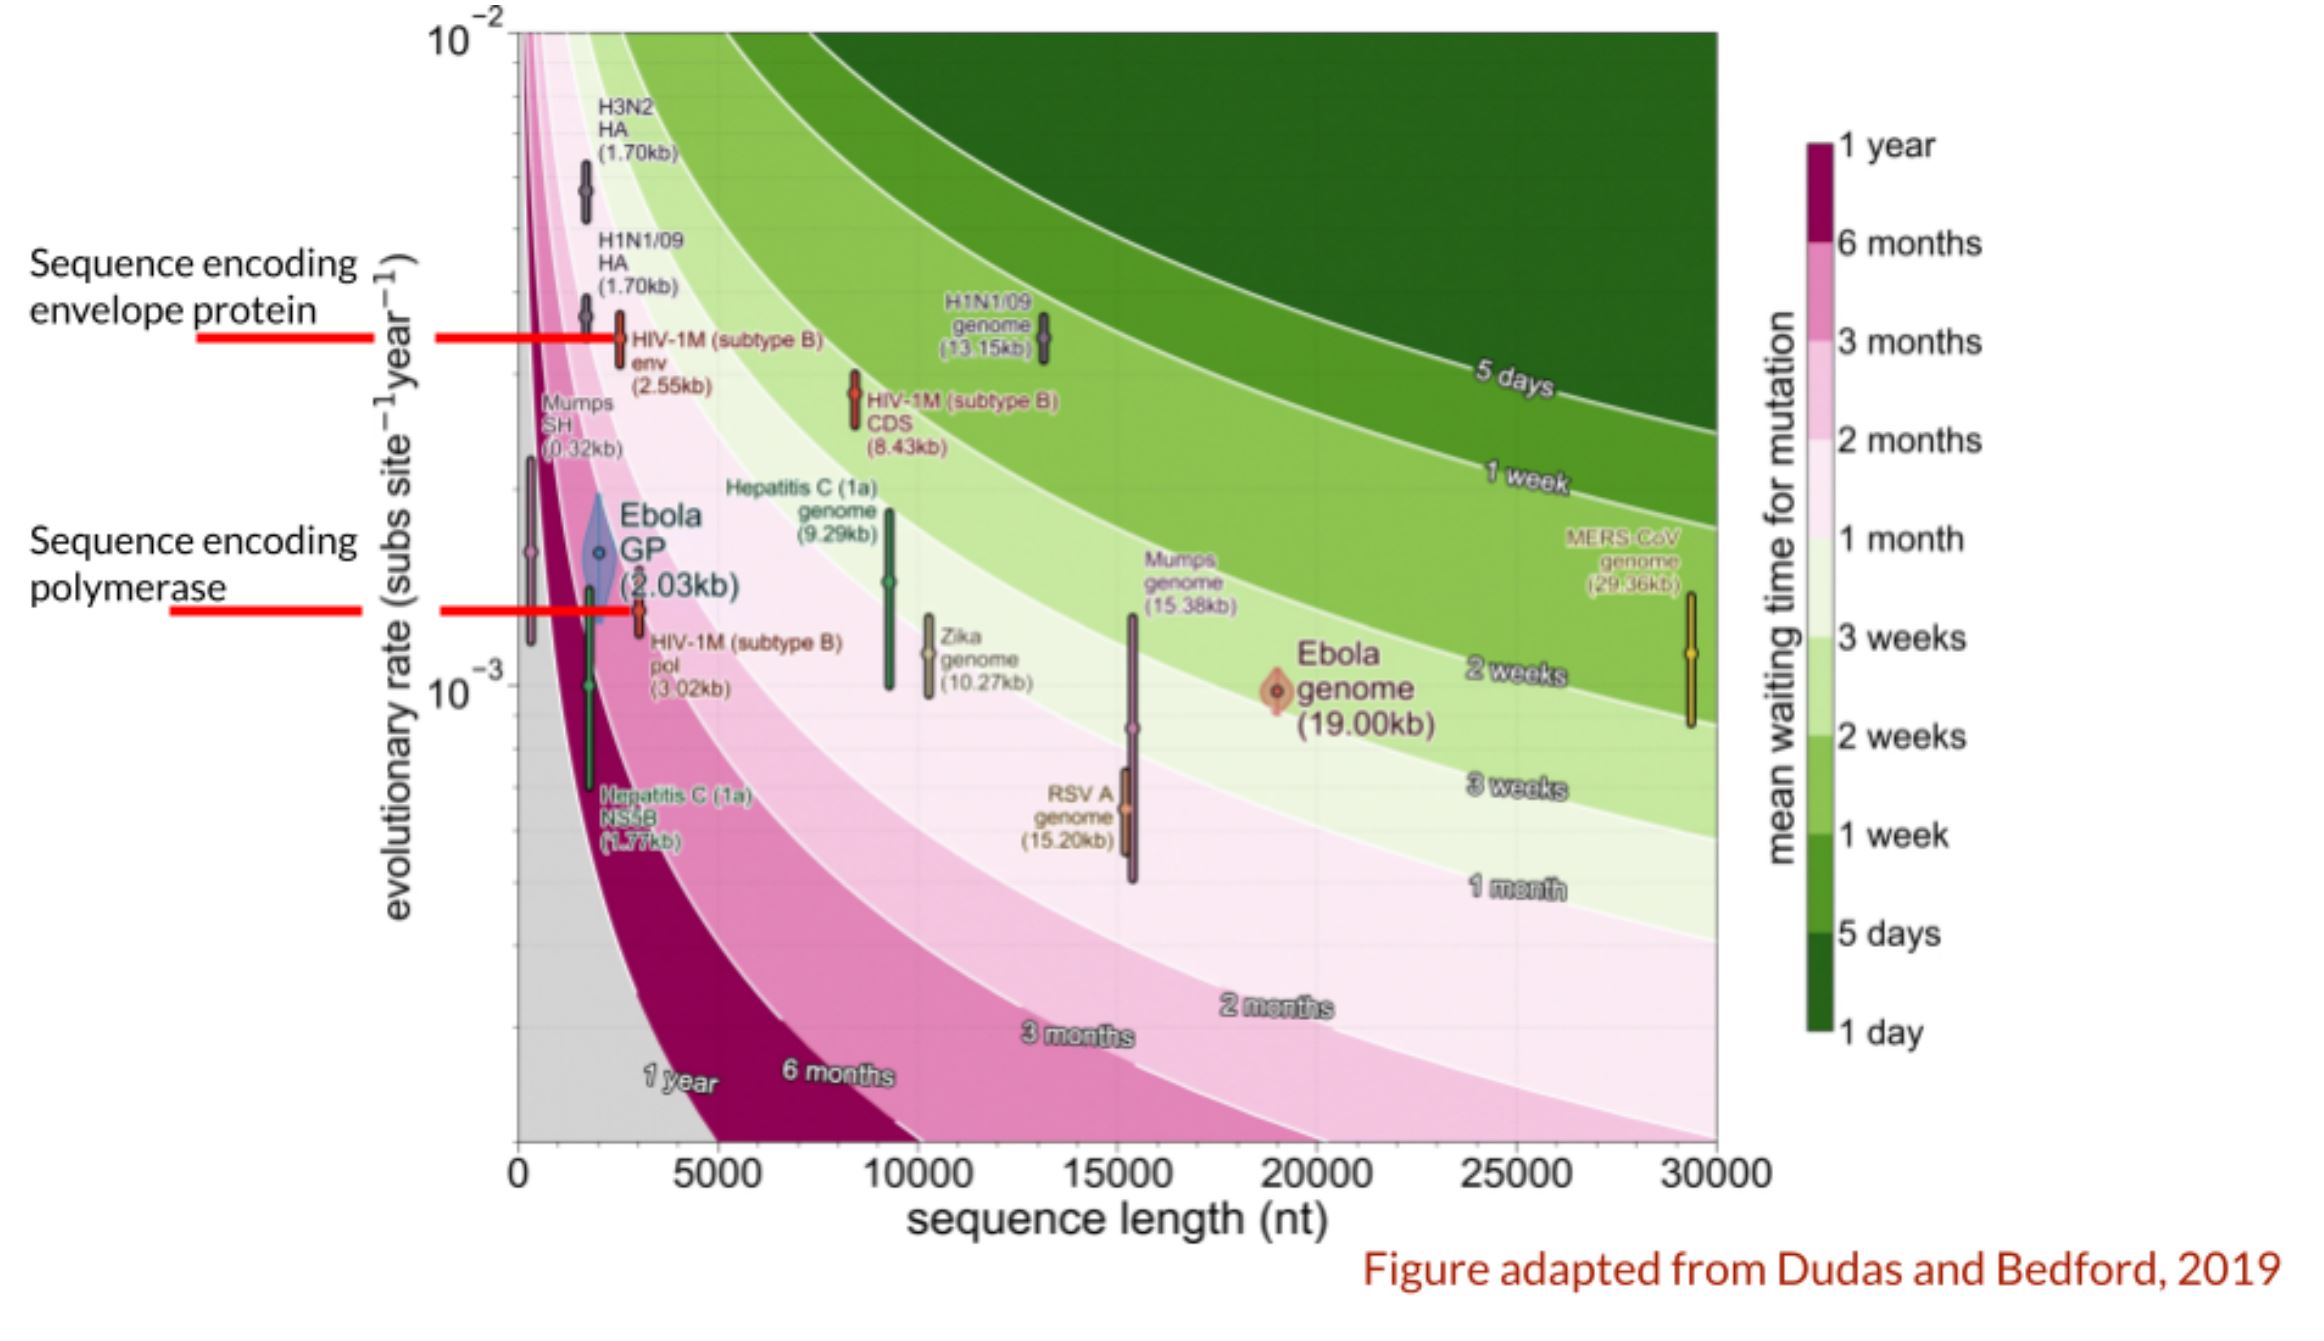
- The figure below is adapted from Dudas and Bedford, 2019, and it shows different evolutionary rates for different viruses, and specific genes within those viruses, and the length of those sequences. Disregard the colours and the genome lengths, and just focus on the evolutionary rates that are pointed out in red. One is the evolutionary rate for the gene that encodes the envelope protein of HIV, which the virus uses to enter into host cells, and is on the exterior of the virus. The other is the evolutionary rate for the polymerase gene, which encodes the viruses RNA-dependent RNA polymerase. Knowing what you know about evolutionary rates, and the reasons for why they can vary, what is a possible explanation for the slower evolutionary rate of the polymerase gene compared to the envelope gene (for the same virus)?