Introduction
The Chan Zuckerberg Biohub released Tabula Muris, a compendium of single-cell transcriptome data from the mouse containing nearly 100,000 cells from 20 organs and tissues. The data allow for direct and controlled comparison of gene expression in cell types shared between tissues, such as immune cells from distinct anatomical locations. They also allow for a comparison of two distinct technical approaches:
- Microfluidic droplet-based 3’-end counting, which provides a survey of thousands of cells per organ at relatively low coverage.
- FACS-based full-length transcript analysis, which provides higher sensitivity and coverage.
We hope this rich collection of annotated cells will be a useful resource for:
- Defining gene expression in cell populations that have been poorly characterized thus far.
- Validating findings in future targeted single-cell studies.
- Developing methods for integrating datasets (e.g., between the FACS and droplet experiments), characterizing batch effects, and quantifying the variation of gene expression in many cell types between organs and animals.
The following will facilitate use of the data. For more detail, check out our paper in Nature.
Data Access
You can access the data at a few levels of depth:
- A simple website shows the distribution of gene expression in each tissue and cell population.
- Matrices of gene-cell counts and metadata are available as CSVs on Figshare.
- R and Python loading instructions (two lines each) are in the easy-data repo on Github.
- The fastq files for each library are available on the Short Read Archive.
For some organs, such as the bladder, diaphragm, and tongue epithelium, this represents the first large single-cell sequencing study to our knowledge. Tabula Muris is also sex-balanced, in contrast with the majority of murine research (a bias so strong that some studies decline even to state the sex of the mice studied). It represents the first large single-cell sequencing study of the female murine liver, kidney, and skin.
Sample Collection
One of the challenges of analyzing single-cell sequencing data is the role of batch effects. Tissues from genetically identical mice processed by different labs using different dissociation, library preparation, and sequencing protocols may produce rather different profiles of gene expression.
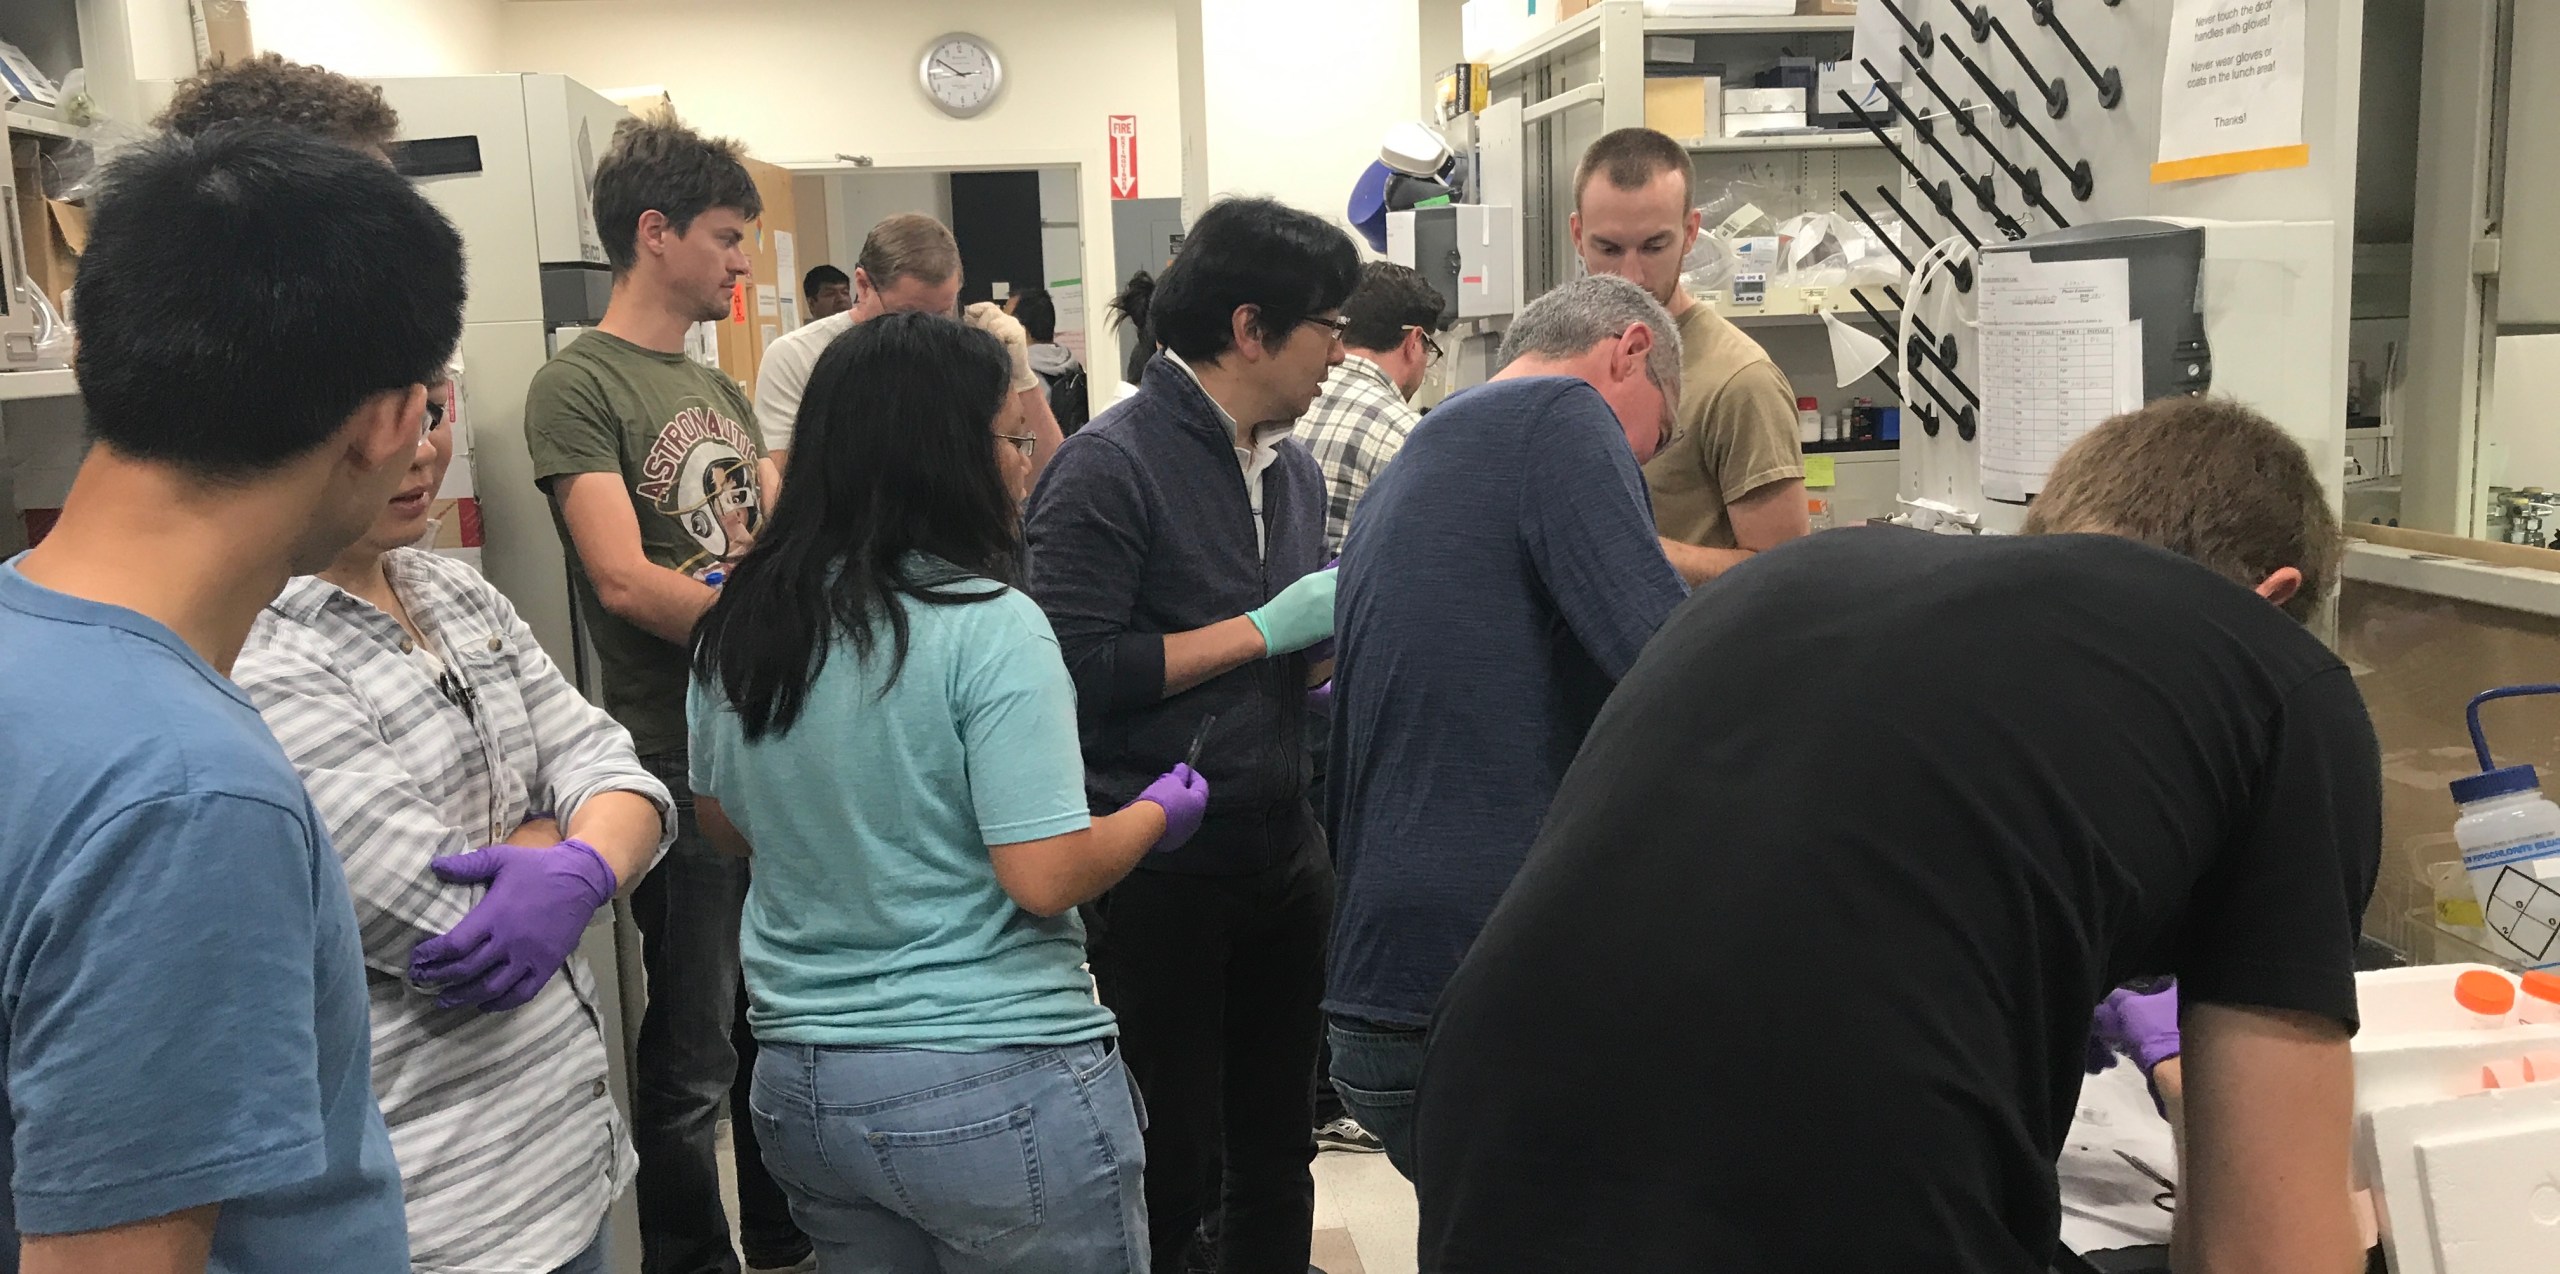
To provide a cross-organ dataset, which is as standardized as possible, the mice were processed in a delicate ballet: representatives from over a dozen labs (each handling one organ or two) gathered as the mouse was sacrificed, extracted their labs’ organ of specialty, dissociated it, and brought it to a central location for sorting and sequencing.

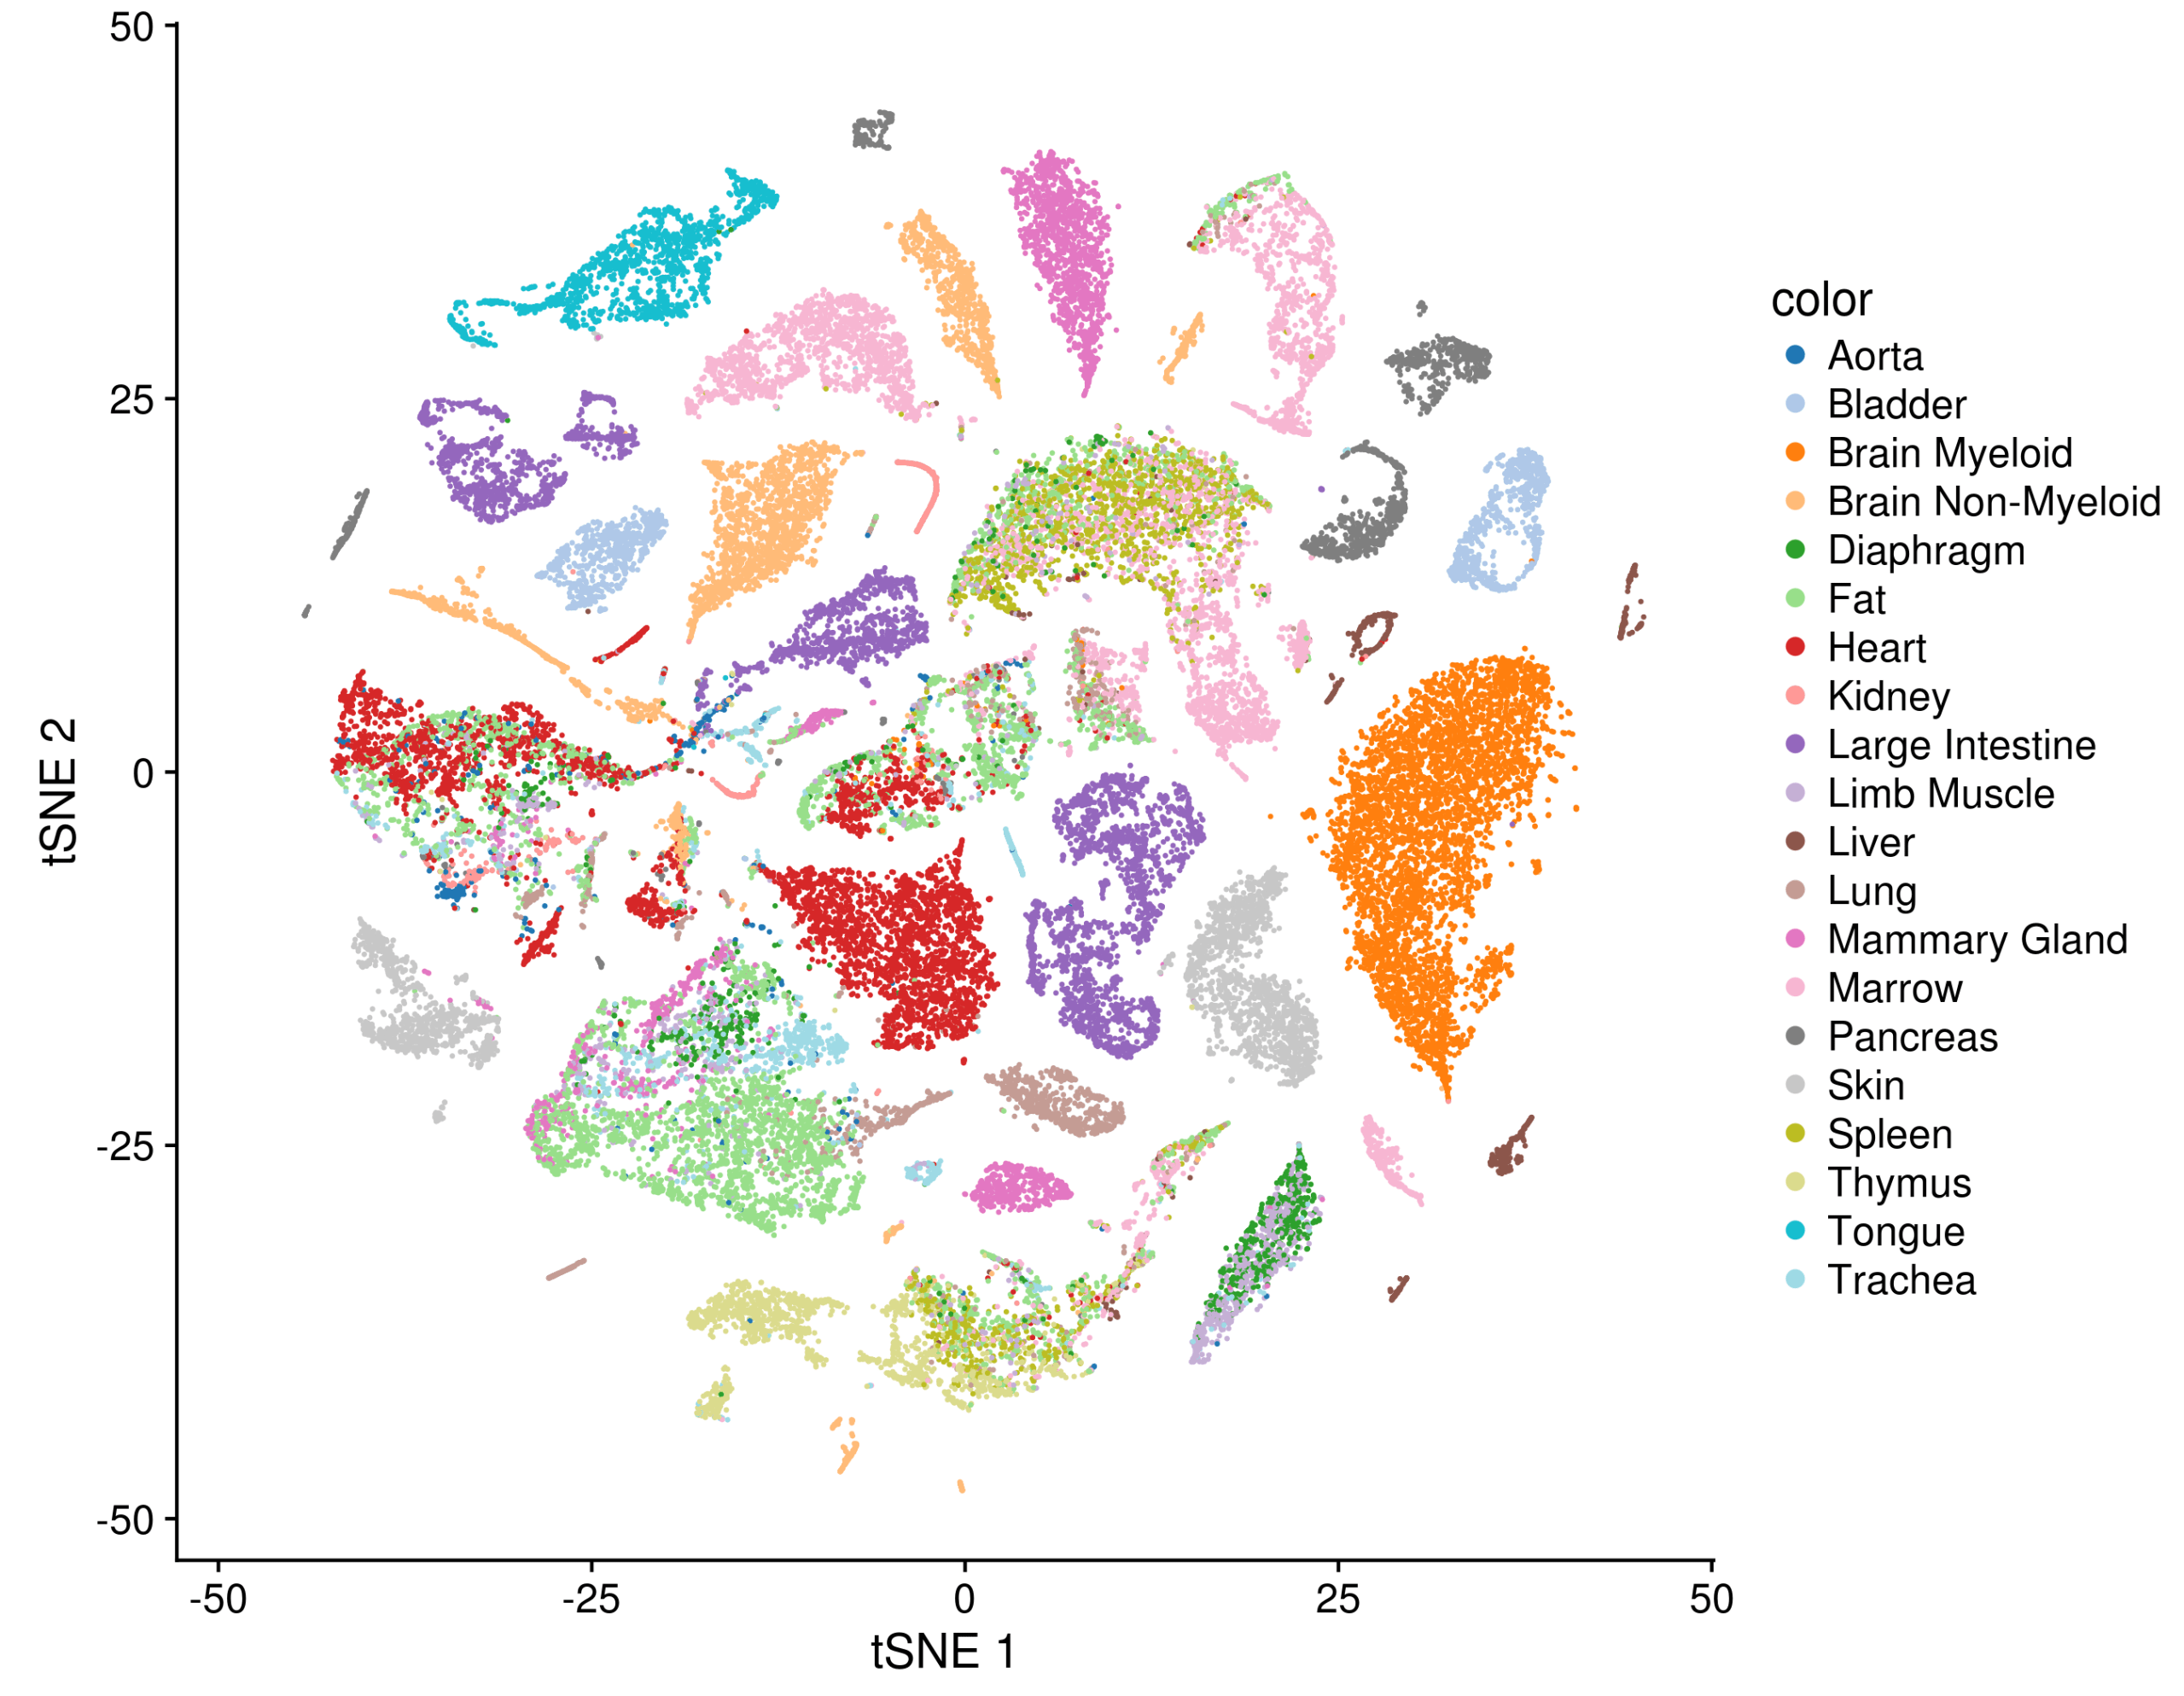
The payoff for taking that much care can be seen in a t-SNE plot of all the FACS-sorted cells together, where common cell types, such as epithelial cells, endothelial cells, or immune cells from different tissues mix together in visible clusters.

Analysis
Cell type annotation in single-cell sequencing is, at present, a semi-supervised problem. It requires expert knowledge (e.g., which marker genes are thought to be uniquely expressed in a given cell type) and high-dimensional data analysis (extracting information from a collection of 20,000-dimensional gene expression vectors). To empower the organ experts from each of the collaborating labs to analyze the data they collected and to make the analysis legible to the community at large, we elected to use a relatively simple pipeline as instantiated in the R software package Seurat.
The pipeline begins with vectors of gene expression in each cell, normalizing the data, selecting highly variable genes, reducing their dimension using PCA, and then clustering cells based on a nearest-neighbors graph.
By inspecting the expression of marker genes (and occasionally computing differentially expressed genes when the markers were not present), researchers were able to identify each cluster. In cases where the profile of gene expression indicated a mixture of populations, they would either tune parameters (such as number of PCs) or subset it and repeat the whole pipeline. To see a worked example, check out the Organ Annotation Vignette, which also describes all of the mathematical functions and parameter values used. The 33 notebooks used to analyze each tissue and experimental method can be found on Github.
Note that this approach does not require that one resolves batch effects; it is enough that, within each batch, cells of different types separate. For example, in the limb muscle, there were two clusters of cells (largely from different mice) that were both recognizable by gene expression as satellite cells.
To facilitate the reuse of this data, we provide annotations in the controlled vocabulary of a cell ontology from The OBO Foundry. Since definitions of cell types are quickly evolving and ontologies require time to catch up, we also included a free annotation field where arbitrary notes could be added. Those include features like subtypes (luminal progenitor cells in the mammary gland) or localization (periportal hepatocytes).


